Ellington Financial Inc. (EFC): Price and Financial Metrics
GET POWR RATINGS... FREE!
EFC POWR Grades
- EFC scores best on the Momentum dimension, with a Momentum rank ahead of 67.84% of US stocks.
- The strongest trend for EFC is in Growth, which has been heading down over the past 177 days.
- EFC ranks lowest in Stability; there it ranks in the 18th percentile.
EFC Stock Summary
- For EFC, its debt to operating expenses ratio is greater than that reported by 99.19% of US equities we're observing.
- Revenue growth over the past 12 months for ELLINGTON FINANCIAL INC comes in at -91.95%, a number that bests just 1.19% of the US stocks we're tracking.
- Shareholder yield, a measure of how much is returned to shareholders via dividends and share repurchases, for EFC comes in at -271.68% -- higher than that of merely 1.96% of stocks in our set.
- Stocks that are quantitatively similar to EFC, based on their financial statements, market capitalization, and price volatility, are BLX, WMC, MITT, CIM, and WHF.
- Visit EFC's SEC page to see the company's official filings. To visit the company's web site, go to www.ellingtonfinancial.com.
EFC Valuation Summary
- In comparison to the median Financial Services stock, EFC's price/sales ratio is 1844.83% higher, now standing at 56.4.
- Over the past 150 months, EFC's price/sales ratio has gone up 49.4.
Below are key valuation metrics over time for EFC.
Stock | Date | P/S | P/B | P/E | EV/EBIT |
---|---|---|---|---|---|
EFC | 2023-01-23 | 56.4 | 0.7 | -11.3 | -72.4 |
EFC | 2023-01-20 | 55.8 | 0.7 | -11.2 | -72.3 |
EFC | 2023-01-19 | 55.6 | 0.7 | -11.2 | -72.3 |
EFC | 2023-01-18 | 55.5 | 0.7 | -11.2 | -72.3 |
EFC | 2023-01-17 | 55.6 | 0.7 | -11.2 | -72.3 |
EFC | 2023-01-13 | 55.6 | 0.7 | -11.2 | -72.3 |
EFC Growth Metrics
- Its 5 year price growth rate is now at -39.77%.
- Its 2 year net income to common stockholders growth rate is now at 187.83%.
- Its 2 year net cashflow from operations growth rate is now at -13.85%.

The table below shows EFC's growth in key financial areas (numbers in millions of US dollars).
Date | Revenue | Operating Cash Flow | Net Income to Common Stock |
---|---|---|---|
2022-09-30 | 14.837 | 62.665 | -73.802 |
2022-06-30 | 40.343 | 88.464 | -19.948 |
2022-03-31 | 113.684 | 75.06 | 77.588 |
2021-12-31 | 151.037 | 51.293 | 125.346 |
2021-09-30 | 184.386 | 95.858 | 154.237 |
2021-06-30 | 199.947 | 97.213 | 179.876 |
EFC's Quality Factors
The “Quality” component of the POWR Ratings focuses on 31 different factors of a companies fundamentals and operational strength. Here are some key insights as we drill into the specifics of these quality attributes.- EFC has a Quality Grade of C, ranking ahead of 61.43% of graded US stocks.
- EFC's asset turnover comes in at 0.053 -- ranking 54th of 63 Real Estate stocks.
- TRNO, RLGY, and HGSH are the stocks whose asset turnover ratios are most correlated with EFC.
The table below shows EFC's key quality metrics over time.
Period | Asset Turnover | Gross Margin | ROIC |
---|---|---|---|
2021-06-30 | 0.053 | 0.900 | 0.032 |
2021-03-31 | 0.059 | 0.941 | 0.035 |
2020-12-31 | 0.014 | 0.753 | 0.006 |
2020-09-30 | 0.003 | 0.022 | -0.004 |
2020-06-30 | -0.004 | 1.623 | -0.009 |
2020-03-31 | -0.012 | 1.206 | -0.013 |
EFC Price Target
For more insight on analysts targets of EFC, see our EFC price target page. And for a list of of all stocks sorted by upside potential based on analyst target price, see our Top Price Target page.
Average Price Target | $19.38 | Average Broker Recommendation | 1.56 (Moderate Buy) |
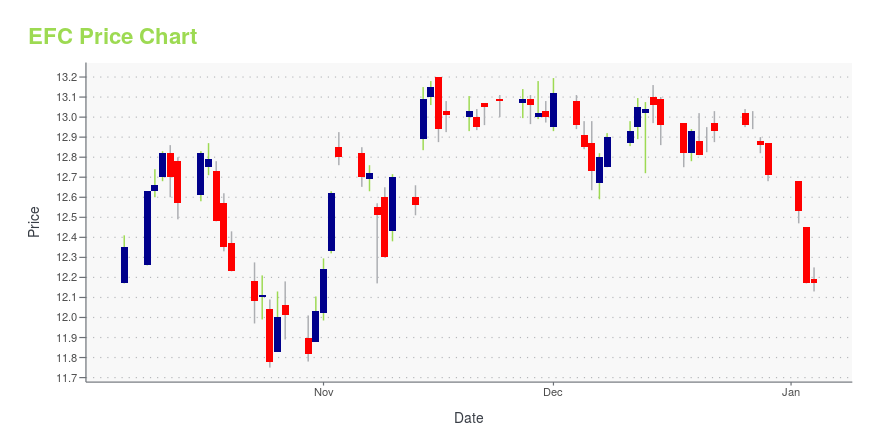
EFC Stock Price Chart Interactive Chart >
EFC Price/Volume Stats
Current price | $13.91 | 52-week high | $18.13 |
Prev. close | $14.05 | 52-week low | $10.81 |
Day low | $13.84 | Volume | 1,233,100 |
Day high | $14.04 | Avg. volume | 779,200 |
50-day MA | $13.42 | Dividend yield | 12.94% |
200-day MA | $14.27 | Market Cap | 840.71M |
Ellington Financial Inc. (EFC) Company Bio
Ellington Financial is a specialty finance company that primarily acquires and manages mortgage-related assets, including residential mortgage-backed securities, residential mortgage loans, commercial mortgage-backed securities, commercial mortgage loans and other commercial real estate debt, real property, and mortgage-related derivatives. The company was founded in 2007 and is based in Old Greenwich, Connecticut.
Latest EFC News From Around the Web
Below are the latest news stories about ELLINGTON FINANCIAL INC that investors may wish to consider to help them evaluate EFC as an investment opportunity.
Ellington Financial Inc. Announces Pricing of Public Offering of 8.625% Series C Fixed-Rate Reset Cumulative Redeemable Preferred StockOLD GREENWICH, Conn., February 02, 2023--Ellington Financial Inc. (NYSE: EFC) (the "Company") announced today that it has priced an underwritten public offering of 4,000,000 shares of 8.625% Series C Fixed-Rate Reset Cumulative Redeemable Preferred Stock (the "Series C Preferred Stock"), with a liquidation preference of $25.00 per share, for gross proceeds of $100 million before deducting underwriting discounts and estimated offering expenses. The Company has granted the underwriters an option f |
Ellington Financial Inc. Announces Public Offering of Series C Preferred StockOLD GREENWICH, Conn., February 02, 2023--Ellington Financial Inc. (NYSE: EFC) (the "Company") announced today that it has commenced an underwritten public offering of Series C Fixed-Rate Reset Cumulative Redeemable Preferred Stock (the "Series C Preferred Stock"). The Company intends to apply to list the Series C Preferred Stock on the New York Stock Exchange under the symbol "EFC PR C." |
LendingTree (TREE) Surges 6.0%: Is This an Indication of Further Gains?Tree.com (TREE) saw its shares surge in the last session with trading volume being higher than average. The latest trend in earnings estimate revisions may not translate into further price increase in the near term. |
Ellington Financial Inc. Announces the Income Tax Treatment of its 2022 DistributionsOLD GREENWICH, Conn., January 31, 2023--Ellington Financial Inc. Announces the Income Tax Treatment of its 2022 Distributions |
10 Best February Dividend Stocks To BuyIn this article, we discuss 10 best February dividend stocks to buy. You can skip our detailed analysis of dividend investment and returns of dividend stocks over the years, and go directly to read 5 Best February Dividend Stocks To Buy. As stock valuations slumped to their lowest levels in 2022, dividend stocks’ performance remained […] |
EFC Price Returns
1-mo | 8.42% |
3-mo | 5.51% |
6-mo | -5.15% |
1-year | -9.73% |
3-year | 2.74% |
5-year | 62.46% |
YTD | 13.68% |
2022 | -18.32% |
2021 | 26.33% |
2020 | -10.16% |
2019 | 32.43% |
2018 | 17.29% |
EFC Dividends
Ex-Dividend Date | Type | Payout Amount | Change | ||||||
---|---|---|---|---|---|---|---|---|---|
Loading, please wait... |
Continue Researching EFC
Want to do more research on Ellington Financial Inc's stock and its price? Try the links below:Ellington Financial Inc (EFC) Stock Price | Nasdaq
Ellington Financial Inc (EFC) Stock Quote, History and News - Yahoo Finance
Ellington Financial Inc (EFC) Stock Price and Basic Information | MarketWatch
Loading social stream, please wait...