
Enbridge Inc. (ENB): Price and Financial Metrics
ENB Price/Volume Stats
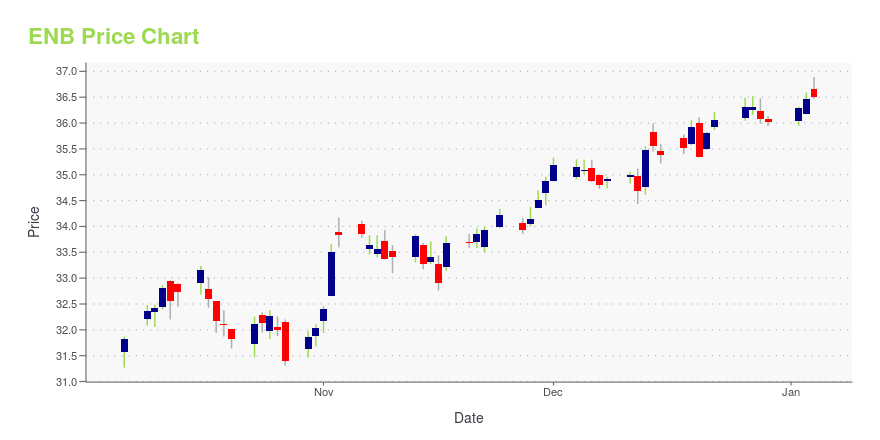
| Current price | $36.66 | 52-week high | $38.37 |
| Prev. close | $36.33 | 52-week low | $31.03 |
| Day low | $36.38 | Volume | 3,064,500 |
| Day high | $36.79 | Avg. volume | 5,468,755 |
| 50-day MA | $35.90 | Dividend yield | 7.36% |
| 200-day MA | $35.17 | Market Cap | 78.23B |
ENB Stock Price Chart Interactive Chart >
Enbridge Inc. (ENB) Company Bio
Enbridge Inc. is a multinational pipeline company headquartered in Calgary, Alberta, Canada. It owns and operates pipelines throughout Canada and the United States, transporting crude oil, natural gas, and natural gas liquids. Enbridge's pipeline system is the longest in North America. Its crude oil system consists of 27,500 kilometres (17,100 miles) of pipelines. Its 38,300 kilometre (23,800 mile) natural gas pipeline system connects multiple Canadian provinces, several US states, and the Gulf of Mexico. Over time, it has grown through acquisition of other existing pipeline companies and the expansion of their projects. Between 2012 and 2021, Enbridge transported over 32 billion barrels of crude oil. (Source:Wikipedia)
Latest ENB News From Around the Web
Below are the latest news stories about ENBRIDGE INC that investors may wish to consider to help them evaluate ENB as an investment opportunity.
Income Investing: 7 Stocks to Buy for a Steady ‘Pay Check’ in 2024One of the easiest ways for investors to get paid consistently is with income investing heading into New Year 2024. |
These Companies Just Hiked Their Dividends — Should You Buy?Dividend stocks have always been an investor favorite, as they provide stable income and diversification benefits. These stocks also tend to hedge investors' portfolios during a market downturn or periods of uncertainty as they provide periodic payouts. While the recent rally of stocks has sparked investor enthusiasm, certain analysts predict the current positive market trend to be a "bull trap," as UBS Managing Partner Michael Riesner said the "current breakouts is the setup for a classic bull |
Could These 3 Ultra-High Yield Stocks Help You Retire a Millionaire?If you are looking to retire with a seven-figure nest egg, consider this high-yield trio as a starting point. |
Lifting Families out of Generational Poverty in the Volunteer StateIn Tennessee, the Highlands Training Center is tackling poverty through training, skills development and workforce re-entry NORTHAMPTON, MA / ACCESSWIRE / December 27, 2023 / TheHighlands Training Centerwas born with a clear goal. Bring 1,600 local ... |
Here's Why You Should Hold on to Enbridge (ENB) Stock NowEnbridge (ENB) is strategically positioned to benefit from industry trends, such as increasing demand for renewable energy and natural gas. |
ENB Price Returns
| 1-mo | 3.97% |
| 3-mo | 4.19% |
| 6-mo | 5.92% |
| 1-year | 8.54% |
| 3-year | 14.18% |
| 5-year | 54.94% |
| YTD | 5.71% |
| 2023 | -1.14% |
| 2022 | 6.43% |
| 2021 | 28.56% |
| 2020 | -11.81% |
| 2019 | 36.04% |
ENB Dividends
| Ex-Dividend Date | Type | Payout Amount | Change | ||||||
|---|---|---|---|---|---|---|---|---|---|
| Loading, please wait... | |||||||||
Continue Researching ENB
Here are a few links from around the web to help you further your research on Enbridge Inc's stock as an investment opportunity:Enbridge Inc (ENB) Stock Price | Nasdaq
Enbridge Inc (ENB) Stock Quote, History and News - Yahoo Finance
Enbridge Inc (ENB) Stock Price and Basic Information | MarketWatch
Loading social stream, please wait...