The Ensign Group, Inc. (ENSG): Price and Financial Metrics
ENSG Price/Volume Stats
Current price | $88.05 | 52-week high | $102.26 |
Prev. close | $88.57 | 52-week low | $70.29 |
Day low | $87.60 | Volume | 200,458 |
Day high | $89.56 | Avg. volume | 281,318 |
50-day MA | $94.19 | Dividend yield | 0.26% |
200-day MA | $90.96 | Market Cap | 4.93B |
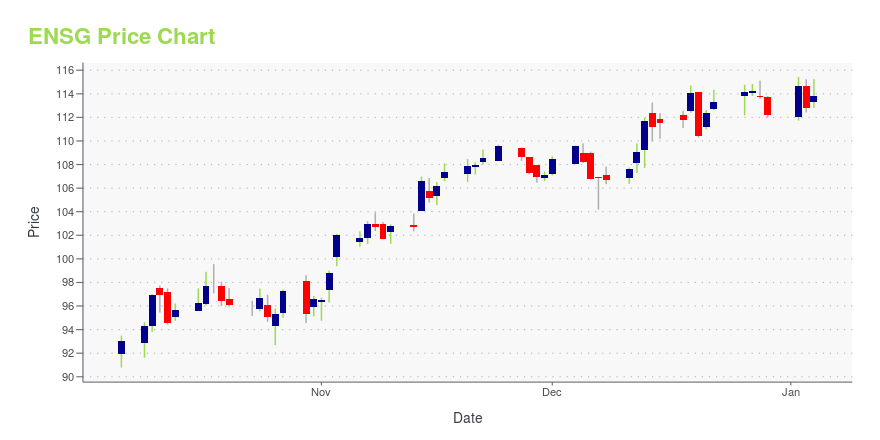
ENSG Stock Price Chart Interactive Chart >
ENSG POWR Grades
- ENSG scores best on the Stability dimension, with a Stability rank ahead of 76.38% of US stocks.
- ENSG's strongest trending metric is Quality; it's been moving down over the last 179 days.
- ENSG's current lowest rank is in the Momentum metric (where it is better than 4.51% of US stocks).
ENSG Stock Summary
- With a one year PEG ratio of 135.19, ENSIGN GROUP INC is expected to have a higher PEG ratio (a measure of how expensive a stock is relative to its expected earnings growth) than 82.67% of US stocks.
- The ratio of debt to operating expenses for ENSIGN GROUP INC is higher than it is for about 88.97% of US stocks.
- In terms of volatility of its share price, ENSG is more volatile than merely 3.16% of stocks we're observing.
- If you're looking for stocks that are quantitatively similar to ENSIGN GROUP INC, a group of peers worth examining would be AFCG, MEC, CRL, STKS, and STRL.
- ENSG's SEC filings can be seen here. And to visit ENSIGN GROUP INC's official web site, go to www.ensigngroup.net.
ENSG Valuation Summary
- In comparison to the median Healthcare stock, ENSG's price/sales ratio is 68.63% lower, now standing at 1.6.
- Over the past 189 months, ENSG's price/sales ratio has gone up 0.7.
Below are key valuation metrics over time for ENSG.
Stock | Date | P/S | P/B | P/E | EV/EBIT |
---|---|---|---|---|---|
ENSG | 2023-05-23 | 1.6 | 3.9 | 21.9 | 21.7 |
ENSG | 2023-05-22 | 1.6 | 3.9 | 22.0 | 21.7 |
ENSG | 2023-05-19 | 1.6 | 3.9 | 22.0 | 21.7 |
ENSG | 2023-05-18 | 1.6 | 3.9 | 21.7 | 21.5 |
ENSG | 2023-05-17 | 1.6 | 3.9 | 21.8 | 21.6 |
ENSG | 2023-05-16 | 1.6 | 3.9 | 21.8 | 21.6 |
ENSG Growth Metrics
- Its 4 year net cashflow from operations growth rate is now at 140.79%.
- Its 5 year cash and equivalents growth rate is now at 100.64%.
- Its 5 year net income to common stockholders growth rate is now at 184.05%.

The table below shows ENSG's growth in key financial areas (numbers in millions of US dollars).
Date | Revenue | Operating Cash Flow | Net Income to Common Stock |
---|---|---|---|
2022-12-31 | 3,025.468 | 272.513 | 224.681 |
2022-09-30 | 2,909.078 | 293.532 | 212.95 |
2022-06-30 | 2,807.603 | 297.1 | 204.052 |
2022-03-31 | 2,713.653 | 287.264 | 195.786 |
2021-12-31 | 2,627.461 | 275.684 | 194.652 |
2021-09-30 | 2,563.348 | 295.679 | 192.233 |
ENSG's Quality Factors
The “Quality” component of the POWR Ratings focuses on 31 different factors of a companies fundamentals and operational strength. Here are some key insights as we drill into the specifics of these quality attributes.- ENSG has a Quality Grade of C, ranking ahead of 73.8% of graded US stocks.
- ENSG's asset turnover comes in at 0.975 -- ranking 22nd of 81 Healthcare stocks.
- DVCR, RDNT, and RHE are the stocks whose asset turnover ratios are most correlated with ENSG.
The table below shows ENSG's key quality metrics over time.
Period | Asset Turnover | Gross Margin | ROIC |
---|---|---|---|
2021-09-30 | 0.975 | 0.175 | 0.083 |
2021-06-30 | 0.981 | 0.173 | 0.081 |
2021-03-31 | 0.975 | 0.171 | 0.079 |
2020-12-31 | 0.972 | 0.170 | 0.075 |
2020-09-30 | 0.859 | 0.166 | 0.065 |
2020-06-30 | 0.869 | 0.158 | 0.059 |
ENSG Price Target
For more insight on analysts targets of ENSG, see our ENSG price target page. And for a list of of all stocks sorted by upside potential based on analyst target price, see our Top Price Target page.
Average Price Target | $96.80 | Average Broker Recommendation | 1.3 (Strong Buy) |
The Ensign Group, Inc. (ENSG) Company Bio
The Ensign Group provides a broad spectrum of skilled nursing and assisted living services, physical, occupational and speech therapies, home health and hospice services, urgent care services and other rehabilitative and healthcare services. The company was founded in 1999 and is based in Mission Viejo, California.
Latest ENSG News From Around the Web
Below are the latest news stories about ENSIGN GROUP INC that investors may wish to consider to help them evaluate ENSG as an investment opportunity.
Here's Why Ensign Group (ENSG) is Poised for a Turnaround After Losing -7.68% in 4 WeeksEnsign Group (ENSG) is technically in oversold territory now, so the heavy selling pressure might have exhausted. This along with strong agreement among Wall Street analysts in raising earnings estimates could lead to a trend reversal for the stock. |
What Is The Ensign Group, Inc.'s (NASDAQ:ENSG) Share Price Doing?While The Ensign Group, Inc. ( NASDAQ:ENSG ) might not be the most widely known stock at the moment, it saw a... |
Ensign Group (ENSG) Beats on Q1 Earnings, Hikes '23 EPS ViewEnsign Group's (ENSG) first-quarter results benefit from growing skilled services revenues. Management estimates EPS of $4.64-$4.77 for this year, higher than the earlier mentioned $4.60-$4.74. |
Ensign Group (ENSG) Q1 Earnings and Revenues Surpass EstimatesEnsign Group (ENSG) delivered earnings and revenue surprises of 2.73% and 4.77%, respectively, for the quarter ended March 2023. Do the numbers hold clues to what lies ahead for the stock? |
The Ensign Group Reports First Quarter 2023 Results; Increases 2023 Annual GuidanceConference Call and Webcast scheduled for tomorrow, April 27, 2023 at 10:00 am PTSAN JUAN CAPISTRANO, Calif., April 26, 2023 (GLOBE NEWSWIRE) -- The Ensign Group, Inc. (Nasdaq: ENSG), the parent company of the Ensign(TM) group of companies, which provide post-acute healthcare services and invest in the long-term healthcare industry, primarily in skilled nursing and senior living facilities, announced operating results for the first quarter of 2023, reporting GAAP diluted earnings per share of $1 |
ENSG Price Returns
1-mo | -9.31% |
3-mo | -2.62% |
6-mo | -6.56% |
1-year | N/A |
3-year | 103.15% |
5-year | 164.76% |
YTD | -6.87% |
2022 | 12.99% |
2021 | 15.43% |
2020 | 61.42% |
2019 | 26.99% |
2018 | 75.67% |
ENSG Dividends
Ex-Dividend Date | Type | Payout Amount | Change | ||||||
---|---|---|---|---|---|---|---|---|---|
Loading, please wait... |
Continue Researching ENSG
Here are a few links from around the web to help you further your research on Ensign Group Inc's stock as an investment opportunity:Ensign Group Inc (ENSG) Stock Price | Nasdaq
Ensign Group Inc (ENSG) Stock Quote, History and News - Yahoo Finance
Ensign Group Inc (ENSG) Stock Price and Basic Information | MarketWatch
Loading social stream, please wait...