Entegris Inc. (ENTG): Price and Financial Metrics

Entegris Inc. (ENTG): $106.20

1.19 (+1.13%)

POWR Rating

Component Grades

Momentum

A

Stability

C

Sentiment

Quality

D

ENTG Price/Volume Stats

Current price $106.20 52-week high $114.47
Prev. close $105.01 52-week low $62.24
Day low $104.55 Volume 1,133,500
Day high $107.37 Avg. volume 1,450,454
50-day MA $96.42 Dividend yield 0.37%
200-day MA $94.08 Market Cap 15.95B

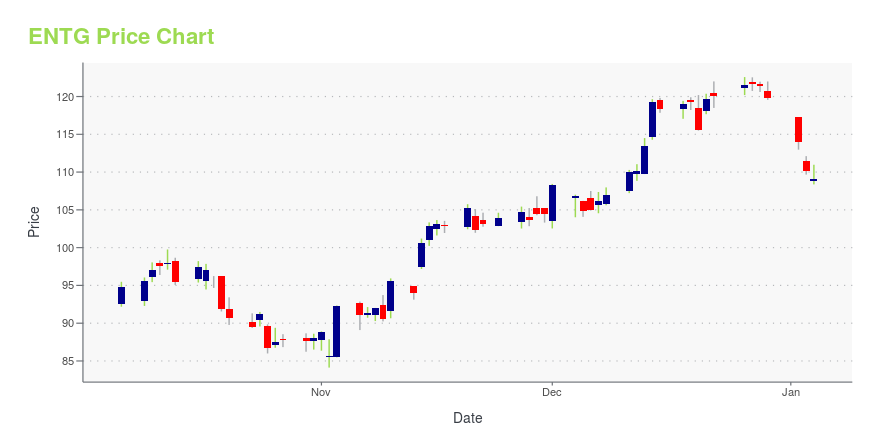
ENTG Stock Price Chart Interactive Chart >

ENTG POWR Grades

  • Momentum is the dimension where ENTG ranks best; there it ranks ahead of 97.72% of US stocks.
  • ENTG's strongest trending metric is Growth; it's been moving up over the last 177 days.
  • ENTG ranks lowest in Quality; there it ranks in the 15th percentile.

ENTG Stock Summary

  • ENTG has a market capitalization of $16,262,207,029 -- more than approximately 87.86% of US stocks.
  • ENTG's one year PEG ratio, measuring expected growth in earnings next year relative to current common stock price is 538.98 -- higher than 94.17% of US-listed equities with positive expected earnings growth.
  • With a price/earnings ratio of 81.26, ENTEGRIS INC P/E ratio is greater than that of about 92.25% of stocks in our set with positive earnings.
  • Stocks with similar financial metrics, market capitalization, and price volatility to ENTEGRIS INC are NOVT, CNHI, HPE, NYT, and ACIW.
  • Visit ENTG's SEC page to see the company's official filings. To visit the company's web site, go to www.entegris.com.

ENTG Valuation Summary

  • In comparison to the median Technology stock, ENTG's price/earnings ratio is 201.55% higher, now standing at 77.8.
  • Over the past 243 months, ENTG's price/sales ratio has gone up 0.6.

Below are key valuation metrics over time for ENTG.

Stock Date P/S P/B P/E EV/EBIT
ENTG 2023-11-28 4.3 4.6 77.8 38.0
ENTG 2023-11-27 4.3 4.7 78.6 38.3
ENTG 2023-11-24 4.3 4.6 77.9 38.0
ENTG 2023-11-22 4.2 4.6 77.4 37.8
ENTG 2023-11-21 4.2 4.6 76.8 37.6
ENTG 2023-11-20 4.3 4.7 79.0 38.4

ENTG Growth Metrics

    The 4 year cash and equivalents growth rate now stands at -14.34%.
  • The 5 year cash and equivalents growth rate now stands at -14.34%.
  • The 4 year price growth rate now stands at 86.06%.
ENTG's revenue has moved up $1,669,687,000 over the prior 34 months.

The table below shows ENTG's growth in key financial areas (numbers in millions of US dollars).

Date Revenue Operating Cash Flow Net Income to Common Stock
2022-12-31 3,282.033 352.283 208.92
2022-09-30 2,971.167 436.21 269.712
2022-06-30 2,556.832 440.182 460.876
2022-03-31 2,435.695 411.127 450.155
2021-12-31 2,298.893 400.454 409.126
2021-09-30 2,181.283 488.492 377.531

ENTG's Quality Factors

The “Quality” component of the POWR Ratings focuses on 31 different factors of a companies fundamentals and operational strength. Here are some key insights as we drill into the specifics of these quality attributes.
  • ENTG has a Quality Grade of C, ranking ahead of 69.71% of graded US stocks.
  • ENTG's asset turnover comes in at 0.743 -- ranking 13th of 22 Rubber and Plastic Products stocks.
  • WST, AWI, and TUP are the stocks whose asset turnover ratios are most correlated with ENTG.

The table below shows ENTG's key quality metrics over time.

Period Asset Turnover Gross Margin ROIC
2021-10-02 0.743 0.456 0.225
2021-07-03 0.723 0.460 0.212
2021-04-03 0.684 0.459 0.202
2020-12-31 0.669 0.457 0.189
2020-09-26 0.660 0.462 0.178
2020-06-27 0.648 0.452 0.155

ENTG Price Target

For more insight on analysts targets of ENTG, see our ENTG price target page. And for a list of of all stocks sorted by upside potential based on analyst target price, see our Top Price Target page.

Average Price Target $135.60 Average Broker Recommendation 1.58 (Moderate Buy)

Entegris Inc. (ENTG) Company Bio


Entegris, Inc. is an American provider of products and systems that purify, protect, and transport critical materials used in the semiconductor device fabrication process. (Source:Wikipedia)


ENTG Latest News Stream


Event/Time News Detail
Loading, please wait...

ENTG Latest Social Stream


Loading social stream, please wait...

View Full ENTG Social Stream

Latest ENTG News From Around the Web

Below are the latest news stories about ENTEGRIS INC that investors may wish to consider to help them evaluate ENTG as an investment opportunity.

Zacks Industry Outlook Highlights Entegris, MKS Instruments and Veeco

Entegris, MKS Instruments and Veeco have been highlighted in this Industry Outlook article.

Yahoo | December 1, 2023

This Mid-Cap Fund Wins Big by Focusing on Fat Dividends

FAM Dividend Focus easily beats its peers and the Russell Midcap index across all time frames, putting the mid-cap fund in the top 2% of the group.

Yahoo | November 29, 2023

Entegris (NASDAQ:ENTG) shareholders have earned a 29% CAGR over the last five years

When you buy shares in a company, it's worth keeping in mind the possibility that it could fail, and you could lose...

Yahoo | November 23, 2023

Entegris Advances Corporate Social Responsibility Strategy and Sets New Aspirations

BILLERICA, Mass., November 16, 2023--Entegris Inc. (Nasdaq: ENTG), a leading supplier of advanced materials and process solutions for the semiconductor and other high-technology industries, today issued its third annual Corporate Social Responsibility (CSR) report. The report, Unleashing a World of Possibilities, is available online and provides a comprehensive overview of Entegris’ continued efforts to advance the company’s CSR strategy across its four key pillars: Innovation, Safety, Personal

Yahoo | November 16, 2023

Entegris (ENTG) Fell on a Lackluster Guidance

The London Company, an investment management company, released “The London Company Mid Cap Strategy” third quarter 2023 investor letter. A copy of the same can be downloaded here. Equities declined broadly in Q3, with the Russell 3000 Index down 3.3% after three consecutive quarterly gains. In the third quarter, the fund declined 3.0% (-3.1% net) during […]

Yahoo | November 8, 2023

Read More 'ENTG' Stories Here

ENTG Price Returns

1-mo 15.46%
3-mo 10.60%
6-mo -2.44%
1-year 48.77%
3-year 8.45%
5-year 307.29%
YTD 62.68%
2022 -52.49%
2021 44.59%
2020 92.86%
2019 80.87%
2018 -7.56%

ENTG Dividends

Ex-Dividend Date Type Payout Amount Change
Loading, please wait...
View Full ENTG Dividend History

Get Free Updates

Join thousands of investors who get the latest news, insights and top rated picks from StockNews.com!