EOG Resources Inc. (EOG): Price and Financial Metrics
GET POWR RATINGS... FREE!
EOG POWR Grades
- Momentum is the dimension where EOG ranks best; there it ranks ahead of 99.98% of US stocks.
- The strongest trend for EOG is in Stability, which has been heading up over the past 179 days.
- EOG's current lowest rank is in the Value metric (where it is better than 26.95% of US stocks).
EOG Stock Summary
- With a market capitalization of $70,619,113,753, Eog Resources Inc has a greater market value than 96.22% of US stocks.
- Of note is the ratio of Eog Resources Inc's sales and general administrative expense to its total operating expenses; merely 3.47% of US stocks have a lower such ratio.
- Over the past twelve months, EOG has reported earnings growth of -1,244.84%, putting it ahead of merely 1.72% of US stocks in our set.
- Stocks that are quantitatively similar to EOG, based on their financial statements, market capitalization, and price volatility, are PXD, NEM, MET, SNP, and WM.
- Visit EOG's SEC page to see the company's official filings. To visit the company's web site, go to www.eogresources.com.
EOG Valuation Summary
- In comparison to the median Energy stock, EOG's EV/EBIT ratio is 11.85% lower, now standing at 16.
- EOG's price/sales ratio has moved up 1.1 over the prior 243 months.
- EOG's EV/EBIT ratio has moved up 11.9 over the prior 243 months.
Below are key valuation metrics over time for EOG.
Stock | Date | P/S | P/B | P/E | EV/EBIT |
---|---|---|---|---|---|
EOG | 2021-09-03 | 3.0 | 1.9 | 21.1 | 16.0 |
EOG | 2021-09-02 | 3.1 | 1.9 | 21.2 | 16.1 |
EOG | 2021-09-01 | 3.0 | 1.9 | 20.6 | 15.6 |
EOG | 2021-08-31 | 3.0 | 1.9 | 21.0 | 15.9 |
EOG | 2021-08-30 | 3.0 | 1.9 | 20.9 | 15.8 |
EOG | 2021-08-27 | 3.1 | 1.9 | 21.6 | 16.3 |
EOG Growth Metrics
- The 4 year revenue growth rate now stands at 131.47%.
- The year over year net income to common stockholders growth rate now stands at -97.03%.
- Its 4 year price growth rate is now at -40.55%.

The table below shows EOG's growth in key financial areas (numbers in millions of US dollars).
Date | Revenue | Operating Cash Flow | Net Income to Common Stock |
---|---|---|---|
2021-12-31 | 18,642 | 8,791 | 4,664 |
2021-09-30 | 15,563.5 | 6,746.238 | 3,016.466 |
2021-06-30 | 13,043.98 | 5,763.791 | 1,878.999 |
2021-03-31 | 10,008.36 | 4,292.865 | 62.615 |
2020-12-31 | 11,032.05 | 5,007.783 | -604.572 |
2020-09-30 | 12,386.8 | 5,693.749 | -305.517 |
EOG's Quality Factors
The “Quality” component of the POWR Ratings focuses on 31 different factors of a companies fundamentals and operational strength. Here are some key insights as we drill into the specifics of these quality attributes.- EOG has a Quality Grade of B, ranking ahead of 92.18% of graded US stocks.
- EOG's asset turnover comes in at 0.426 -- ranking 63rd of 137 Petroleum and Natural Gas stocks.
- VLO, WTI, and HFC are the stocks whose asset turnover ratios are most correlated with EOG.
The table below shows EOG's key quality metrics over time.
Period | Asset Turnover | Gross Margin | ROIC |
---|---|---|---|
2021-09-30 | 0.426 | 0.608 | 0.117 |
2021-06-30 | 0.362 | 0.591 | 0.074 |
2021-03-31 | 0.281 | 0.535 | 0.009 |
2020-12-31 | 0.307 | 0.550 | -0.015 |
2020-09-30 | 0.342 | 0.542 | -0.004 |
2020-06-30 | 0.394 | 0.539 | 0.019 |
EOG Price Target
For more insight on analysts targets of EOG, see our EOG price target page. And for a list of of all stocks sorted by upside potential based on analyst target price, see our Top Price Target page.
Average Price Target | $99.69 | Average Broker Recommendation | 1.56 (Moderate Buy) |
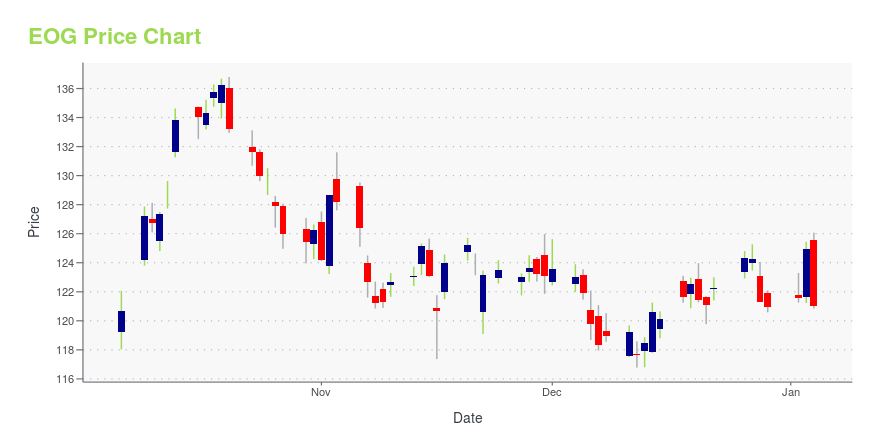
EOG Stock Price Chart Interactive Chart >
EOG Price/Volume Stats
Current price | $112.19 | 52-week high | $147.99 |
Prev. close | $112.28 | 52-week low | $62.81 |
Day low | $110.14 | Volume | 1,590,007 |
Day high | $114.33 | Avg. volume | 4,496,672 |
50-day MA | $112.35 | Dividend yield | 2.67% |
200-day MA | $109.61 | Market Cap | 65.75B |
EOG Resources Inc. (EOG) Company Bio
EOG Resources, Inc. is an American energy company engaged in hydrocarbon exploration. It is organized in Delaware and headquartered in the Heritage Plaza building in Houston, Texas. (Source:Wikipedia)
Latest EOG News From Around the Web
Below are the latest news stories about Eog Resources Inc that investors may wish to consider to help them evaluate EOG as an investment opportunity.
Wall Street Loves EOG ResourcesNo summary available. |
EOG Resources: Fourth Quarter 2021 Results AnalysisNo summary available. |
EOG Resources, Inc. (EOG) CEO Ezra Yacob on Q4 2021 Results - Earnings Call TranscriptEOG Resources, Inc. (EOG) Q4 2021 Earnings Conference Call February 25, 2022 10:00 AM ET Company Participants Tim Driggers - CFO Ezra Yacob - CEO Lloyd Helms - President Kenneth Boedeker - Senior Key Executive Lance Terveen - Senior VP, Marketing Jeffrey Leitzell - Senior Key Executive Conference Call Participants... |
7 Energy Stocks That Will Rise With Oil PricesWhen investors look for relative strength assets, energy stocks are one of the few groups that have been strong all year. |
EOG Resources, Inc. 2021 Q4 - Results - Earnings Call PresentationNo summary available. |
EOG Price Returns
1-mo | 15.33% |
3-mo | -6.51% |
6-mo | 3.28% |
1-year | 82.67% |
3-year | 69.10% |
5-year | 56.40% |
YTD | 31.87% |
2021 | 88.62% |
2020 | -38.64% |
2019 | -2.82% |
2018 | -18.66% |
2017 | 7.48% |
EOG Dividends
Ex-Dividend Date | Type | Payout Amount | Change | ||||||
---|---|---|---|---|---|---|---|---|---|
Loading, please wait... |
Continue Researching EOG
Want to do more research on Eog Resources Inc's stock and its price? Try the links below:Eog Resources Inc (EOG) Stock Price | Nasdaq
Eog Resources Inc (EOG) Stock Quote, History and News - Yahoo Finance
Eog Resources Inc (EOG) Stock Price and Basic Information | MarketWatch
Loading social stream, please wait...