
Enerpac Tool Group Corp. (EPAC): Price and Financial Metrics
EPAC Price/Volume Stats
| Current price | $37.86 | 52-week high | $38.31 |
| Prev. close | $37.57 | 52-week low | $23.32 |
| Day low | $37.67 | Volume | 280,900 |
| Day high | $38.31 | Avg. volume | 277,341 |
| 50-day MA | $34.87 | Dividend yield | 0.11% |
| 200-day MA | $30.13 | Market Cap | 2.05B |
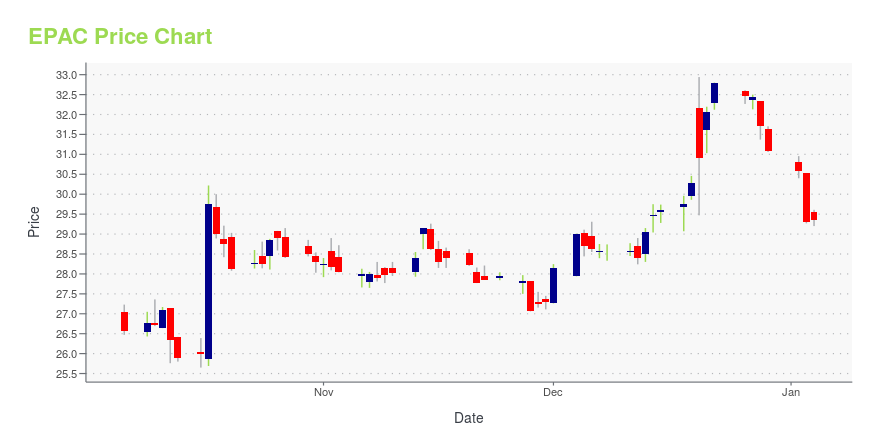
EPAC Stock Price Chart Interactive Chart >
Enerpac Tool Group Corp. (EPAC) Company Bio
Enerpac Tool Group Corp. manufactures and sells a range of industrial products and solutions worldwide. It operates in two segments, Industrial Tools & Services (IT&S) and Other. The IT&S segment designs, manufactures, and distributes branded hydraulic and mechanical tools; and provides services and tool rentals to the industrial, maintenance, infrastructure, oil and gas, energy, and other markets. It also offers branded tools and engineered heavy lifting technology solutions, and hydraulic torque wrenches; energy maintenance and manpower services; high-force hydraulic and mechanical tools, including cylinders, pumps, valves, and specialty tools; and bolt tensioners and other miscellaneous products. This segment markets its branded tools and services primarily under the Enerpac, Hydratight, Larzep, and Simplex brands. The Other segment designs and manufactures synthetic ropes and biomedical assemblies. The company was formerly known as Actuant Corporation and changed its name to Enerpac Tool Group Corp. in January 2020. Enerpac Tool Group Corp. was founded in 1910 and is headquartered in Menomonee Falls, Wisconsin.
Latest EPAC News From Around the Web
Below are the latest news stories about ENERPAC TOOL GROUP CORP that investors may wish to consider to help them evaluate EPAC as an investment opportunity.
Enerpac Tool Group Corp. (NYSE:EPAC) Q1 2024 Earnings Call TranscriptEnerpac Tool Group Corp. (NYSE:EPAC) Q1 2024 Earnings Call Transcript December 20, 2023 Enerpac Tool Group Corp. isn’t one of the 30 most popular stocks among hedge funds at the end of the third quarter (see the details here). Operator: Ladies and gentlemen, thank you for standing by. Welcome to the Enerpac Tool Group’s First […] |
Q1 2024 Enerpac Tool Group Corp Earnings CallQ1 2024 Enerpac Tool Group Corp Earnings Call |
EPAC Stock Earnings: Enerpac Tool Group Beats EPS, Beats Revenue for Q1 2024EPAC stock results show that Enerpac Tool Group beat analyst estimates for earnings per share and beat on revenue for the first quarter of 2024. |
Enerpac Tool Group Corp (EPAC) Reports Solid Q1 Fiscal 2024 Results, Affirms Full-Year GuidanceOrganic Growth and Margin Expansion Drive Performance; Shareholder Returns Through Repurchases Highlighted |
Enerpac Tool Group Reports First Quarter Fiscal 2024 Results and Affirms Full-Year GuidanceMILWAUKEE, December 19, 2023--Enerpac Tool Group Corp. (NYSE: EPAC) today announced results for its fiscal first quarter ended November 30, 2023. |
EPAC Price Returns
| 1-mo | 6.80% |
| 3-mo | 20.65% |
| 6-mo | 35.07% |
| 1-year | 60.12% |
| 3-year | 34.20% |
| 5-year | 55.86% |
| YTD | 21.78% |
| 2023 | 22.34% |
| 2022 | 25.74% |
| 2021 | -10.14% |
| 2020 | -12.95% |
| 2019 | 24.21% |
EPAC Dividends
| Ex-Dividend Date | Type | Payout Amount | Change | ||||||
|---|---|---|---|---|---|---|---|---|---|
| Loading, please wait... | |||||||||
Loading social stream, please wait...