Enterprise Products Partners L.P. (EPD): Price and Financial Metrics
GET POWR RATINGS... FREE!
EPD POWR Grades
- Momentum is the dimension where EPD ranks best; there it ranks ahead of 97.62% of US stocks.
- EPD's strongest trending metric is Growth; it's been moving up over the last 177 days.
- EPD's current lowest rank is in the Growth metric (where it is better than 35.25% of US stocks).
EPD Stock Summary
- EPD has a market capitalization of $57,260,994,241 -- more than approximately 96% of US stocks.
- For EPD, its debt to operating expenses ratio is greater than that reported by 99.41% of US equities we're observing.
- In terms of volatility of its share price, EPD is more volatile than just 3.3% of stocks we're observing.
- Stocks that are quantitatively similar to EPD, based on their financial statements, market capitalization, and price volatility, are OCSL, TCPC, BCSF, SACH, and SCM.
- Visit EPD's SEC page to see the company's official filings. To visit the company's web site, go to www.enterpriseproducts.com.
EPD Valuation Summary
- EPD's price/earnings ratio is 11; this is 17.02% higher than that of the median Energy stock.
- Over the past 243 months, EPD's EV/EBIT ratio has gone down 21.
Below are key valuation metrics over time for EPD.
Stock | Date | P/S | P/B | P/E | EV/EBIT |
---|---|---|---|---|---|
EPD | 2023-01-13 | 1 | 2.1 | 11.0 | 13.2 |
EPD | 2023-01-12 | 1 | 2.1 | 11.0 | 13.2 |
EPD | 2023-01-11 | 1 | 2.1 | 10.9 | 13.1 |
EPD | 2023-01-10 | 1 | 2.1 | 10.8 | 13.1 |
EPD | 2023-01-09 | 1 | 2.1 | 10.8 | 13.1 |
EPD | 2023-01-06 | 1 | 2.1 | 10.7 | 13.0 |
EPD Growth Metrics
- Its 4 year price growth rate is now at -36.27%.
- Its year over year net income to common stockholders growth rate is now at 21.9%.
- The 2 year net cashflow from operations growth rate now stands at 17.12%.

The table below shows EPD's growth in key financial areas (numbers in millions of US dollars).
Date | Revenue | Operating Cash Flow | Net Income to Common Stock |
---|---|---|---|
2022-09-30 | 55,906.2 | 7,439.2 | 5,095.4 |
2022-06-30 | 51,269.5 | 8,759.5 | 4,888.4 |
2022-03-31 | 44,659.6 | 8,634.4 | 4,589.7 |
2021-12-31 | 40,806.9 | 8,512.5 | 4,634.1 |
2021-09-30 | 36,480.9 | 7,987.2 | 3,943 |
2021-06-30 | 32,571.6 | 6,714.7 | 3,842.6 |
EPD's Quality Factors
The “Quality” component of the POWR Ratings focuses on 31 different factors of a companies fundamentals and operational strength. Here are some key insights as we drill into the specifics of these quality attributes.- EPD has a Quality Grade of C, ranking ahead of 45.82% of graded US stocks.
- EPD's asset turnover comes in at 0.506 -- ranking 12th of 105 Utilities stocks.
- UGI, NJR, and AROC are the stocks whose asset turnover ratios are most correlated with EPD.
The table below shows EPD's key quality metrics over time.
Period | Asset Turnover | Gross Margin | ROIC |
---|---|---|---|
2021-06-30 | 0.506 | 0.154 | 0.069 |
2021-03-31 | 0.453 | 0.173 | 0.069 |
2020-12-31 | 0.432 | 0.178 | 0.066 |
2020-09-30 | 0.451 | 0.195 | 0.077 |
2020-06-30 | 0.473 | 0.189 | 0.080 |
2020-03-31 | 0.521 | 0.177 | 0.082 |
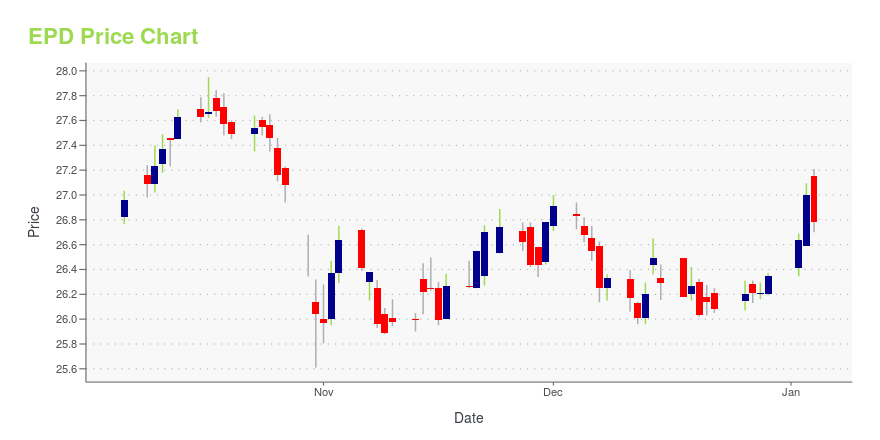
EPD Stock Price Chart Interactive Chart >
EPD Price/Volume Stats
Current price | $25.59 | 52-week high | $28.65 |
Prev. close | $26.53 | 52-week low | $22.75 |
Day low | $25.42 | Volume | 8,351,319 |
Day high | $26.09 | Avg. volume | 5,207,979 |
50-day MA | $24.75 | Dividend yield | 7.16% |
200-day MA | $25.54 | Market Cap | 55.67B |
Enterprise Products Partners L.P. (EPD) Company Bio
Enterprise Products Partners LP provides midstream energy services to producers and consumers of natural gas, natural gas liquids, crude oil, petrochemicals, and refined products in the United States and internationally. The company was founded in 1968 and is based in Houston, Texas.
Latest EPD News From Around the Web
Below are the latest news stories about ENTERPRISE PRODUCTS PARTNERS LP that investors may wish to consider to help them evaluate EPD as an investment opportunity.
Brokers Suggest Investing in Enterprise Products (EPD): Read This Before Placing a BetThe average brokerage recommendation (ABR) for Enterprise Products (EPD) is equivalent to a Buy. The overly optimistic recommendations of Wall Street analysts make the effectiveness of this highly sought-after metric questionable. So, is it worth buying the stock? |
Is a Beat in Store for Helmerich & Payne (HP) in Q1 Earnings?Strong performance of its North America Solutions segment is likely to have boosted Helmerich & Payne's (HP) profit levels in the fiscal first quarter. |
5 Exceptional Dividend Stocks Yielding 5% (or More) to Buy Hand Over FistFive high-yielding dividend stocks with exceptional growth track records are Blackstone (NYSE: BX), Enterprise Products Partners (NYSE: EPD), ONEOK (NYSE: OKE), Verizon (NYSE: VZ), and W. P. Carey (NYSE: WPC). That combination of income and growth makes them great dividend stocks to buy hand over fist these days. |
Is a Beat in Store for ExxonMobil (XOM) in Q4 Earnings?Strong contributions from upstream operations are likely to have aided ExxonMobil's (XOM) earnings in Q4. |
Sleep Well At Night Infrastructure: Enterprise Products And Brookfield InfrastructureWe have been buying infrastructure investments hand-over-fist. This article shows two of our favorite long-term dividend growth names. Read more on BIP and EPD. |
EPD Price Returns
1-mo | 8.09% |
3-mo | 3.87% |
6-mo | 1.58% |
1-year | 16.43% |
3-year | 27.49% |
5-year | 34.92% |
YTD | 8.09% |
2022 | 18.32% |
2021 | 21.40% |
2020 | -23.61% |
2019 | 21.87% |
2018 | -1.31% |
EPD Dividends
Ex-Dividend Date | Type | Payout Amount | Change | ||||||
---|---|---|---|---|---|---|---|---|---|
Loading, please wait... |
Continue Researching EPD
Want to see what other sources are saying about Enterprise Products Partners Lp's financials and stock price? Try the links below:Enterprise Products Partners Lp (EPD) Stock Price | Nasdaq
Enterprise Products Partners Lp (EPD) Stock Quote, History and News - Yahoo Finance
Enterprise Products Partners Lp (EPD) Stock Price and Basic Information | MarketWatch
Loading social stream, please wait...