EQT Corporation (EQT): Price and Financial Metrics
GET POWR RATINGS... FREE!
EQT POWR Grades
- EQT scores best on the Momentum dimension, with a Momentum rank ahead of 96.89% of US stocks.
- EQT's strongest trending metric is Momentum; it's been moving down over the last 177 days.
- EQT's current lowest rank is in the Sentiment metric (where it is better than 5.72% of US stocks).
EQT Stock Summary
- EQT CORP's stock had its IPO on November 5, 1987, making it an older stock than 91.57% of US equities in our set.
- Of note is the ratio of EQT CORP's sales and general administrative expense to its total operating expenses; merely 3.72% of US stocks have a lower such ratio.
- As for revenue growth, note that EQT's revenue has grown 1,545.38% over the past 12 months; that beats the revenue growth of 99.27% of US companies in our set.
- Stocks that are quantitatively similar to EQT, based on their financial statements, market capitalization, and price volatility, are NOG, DEN, OBE, PTEN, and MTDR.
- EQT's SEC filings can be seen here. And to visit EQT CORP's official web site, go to www.eqt.com.
EQT Valuation Summary
- In comparison to the median Energy stock, EQT's price/sales ratio is 11.11% lower, now standing at 1.6.
- EQT's price/sales ratio has moved down 0.4 over the prior 243 months.
Below are key valuation metrics over time for EQT.
Stock | Date | P/S | P/B | P/E | EV/EBIT |
---|---|---|---|---|---|
EQT | 2023-01-13 | 1.6 | 1.3 | 6.9 | 8.0 |
EQT | 2023-01-12 | 1.6 | 1.3 | 6.9 | 8.0 |
EQT | 2023-01-11 | 1.6 | 1.3 | 6.6 | 7.8 |
EQT | 2023-01-10 | 1.6 | 1.3 | 6.7 | 7.9 |
EQT | 2023-01-09 | 1.6 | 1.3 | 6.8 | 8.0 |
EQT | 2023-01-06 | 1.6 | 1.3 | 6.6 | 7.8 |
EQT Growth Metrics
- Its 5 year net income to common stockholders growth rate is now at -436.11%.
- Its year over year net cashflow from operations growth rate is now at 58.89%.
- Its 4 year revenue growth rate is now at 123.4%.

The table below shows EQT's growth in key financial areas (numbers in millions of US dollars).
Date | Revenue | Operating Cash Flow | Net Income to Common Stock |
---|---|---|---|
2022-09-30 | 7,857.555 | 3,572.704 | 1,860.316 |
2022-06-30 | 4,323.254 | 2,470.694 | -803.471 |
2022-03-31 | 1,535.63 | 2,283.752 | -2,631.289 |
2021-12-31 | 3,064.663 | 1,662.448 | -1,155.759 |
2021-09-30 | 477.554 | 897.626 | -2,893.404 |
2021-06-30 | 2,114.519 | 1,033.974 | -1,513.927 |
EQT's Quality Factors
The “Quality” component of the POWR Ratings focuses on 31 different factors of a companies fundamentals and operational strength. Here are some key insights as we drill into the specifics of these quality attributes.- EQT has a Quality Grade of D, ranking ahead of 13.84% of graded US stocks.
- EQT's asset turnover comes in at 0.024 -- ranking 134th of 137 Petroleum and Natural Gas stocks.
- SD, CPE, and APA are the stocks whose asset turnover ratios are most correlated with EQT.
The table below shows EQT's key quality metrics over time.
Period | Asset Turnover | Gross Margin | ROIC |
---|---|---|---|
2021-09-30 | 0.024 | -3.255 | -0.154 |
2021-06-30 | 0.116 | 0.079 | -0.083 |
2021-03-31 | 0.162 | 0.352 | -0.042 |
2020-12-31 | 0.169 | 0.390 | -0.045 |
2020-09-30 | 0.154 | 0.338 | -0.118 |
2020-06-30 | 0.190 | 0.479 | -0.099 |
EQT Price Target
For more insight on analysts targets of EQT, see our EQT price target page. And for a list of of all stocks sorted by upside potential based on analyst target price, see our Top Price Target page.
Average Price Target | $26.66 | Average Broker Recommendation | 1.55 (Moderate Buy) |
EQT Stock Price Chart Interactive Chart >
EQT Price/Volume Stats
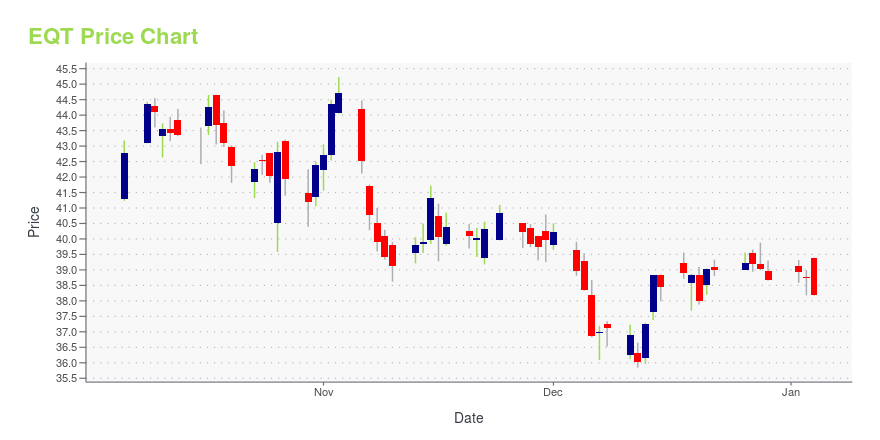
Current price | $32.93 | 52-week high | $51.97 |
Prev. close | $33.10 | 52-week low | $20.37 |
Day low | $32.78 | Volume | 4,212,800 |
Day high | $33.60 | Avg. volume | 6,770,072 |
50-day MA | $36.85 | Dividend yield | 1.82% |
200-day MA | $41.04 | Market Cap | 12.09B |
EQT Corporation (EQT) Company Bio
EQT Corporation explores for, as well as develops and produces natural gas, natural gas liquids, and crude oil. The company also provides natural gas gathering, transmission, and storage services for the companys produced gas, as well as for independent third parties. The company was founded in 1925 and is based in Pittsburgh, Pennsylvania.
Latest EQT News From Around the Web
Below are the latest news stories about EQT CORP that investors may wish to consider to help them evaluate EQT as an investment opportunity.
Are Oil And Gas Stocks A Buy?Companies in the midstream segment transport the crude oil and raw gas to storage facilities, where they then handle the sale and transport of it to downstream providers. |
11 Most Undervalued Natural Gas Stocks To Buy According To Hedge FundsIn this article, we discuss 11 most undervalued natural gas stocks to buy according to hedge funds. If you want to see more stocks in this selection, check out 5 Most Undervalued Natural Gas Stocks To Buy According To Hedge Funds. In 2022, the oil and gas industry experienced exceptional financial success, resulting in a […] |
Can EQT Corporation (NYSE: EQT) Be A Safe Investment Now?EQT Corporation (NYSE:EQT) shares, rose in value on Friday, January 20, with the stock price up by 0.46% to the previous day’s close as strong demand from buyers drove the stock to $34.08. Actively observing the price movement in the recent trading, the stock is buoying the session at $33.93, falling within a range of … Can EQT Corporation (NYSE: EQT) Be A Safe Investment Now? Read More » |
EQT Corporation (NYSE:EQT) stock: You might be surprisedEQT Corporation (EQT)’s stock is trading at $33.74 at the moment marking a rise of 0.27% from the last session close. As of this writing, shares are priced at -35.08% less than their 52-week high of $51.97, and 75.73% over their 52-week low of $19.20. Based on the past 30-day period, the stock price is […] |
Unusual Ways to Leverage Your Investment: Cenntro Electric Group Limited (NASDAQ:CENN 3.52%), EQT Corporation (NYSE:EQT 1.09%)CENN has seen its SMA50 which is now -8.23%. In looking the SMA 200 we see that the stock has seen a -56.99%. EQT has seen its SMA50 which is … The post Unusual Ways to Leverage Your Investment: Cenntro Electric Group Limited (NASDAQ:CENN 3.52%), EQT Corporation (NYSE:EQT 1.09%) appeared first on Stocks Equity . |
EQT Price Returns
1-mo | -2.78% |
3-mo | -14.58% |
6-mo | -21.63% |
1-year | 58.31% |
3-year | 452.67% |
5-year | 10.01% |
YTD | -2.66% |
2022 | 57.64% |
2021 | 71.60% |
2020 | 17.27% |
2019 | -41.82% |
2018 | -38.84% |
EQT Dividends
Ex-Dividend Date | Type | Payout Amount | Change | ||||||
---|---|---|---|---|---|---|---|---|---|
Loading, please wait... |
Continue Researching EQT
Want to see what other sources are saying about EQT Corp's financials and stock price? Try the links below:EQT Corp (EQT) Stock Price | Nasdaq
EQT Corp (EQT) Stock Quote, History and News - Yahoo Finance
EQT Corp (EQT) Stock Price and Basic Information | MarketWatch
Loading social stream, please wait...