ESSA Bancorp, Inc. - common stock (ESSA): Price and Financial Metrics
ESSA Price/Volume Stats
Current price | $18.23 | 52-week high | $20.87 |
Prev. close | $17.86 | 52-week low | $12.79 |
Day low | $17.50 | Volume | 8,990 |
Day high | $18.23 | Avg. volume | 14,493 |
50-day MA | $18.20 | Dividend yield | 3.47% |
200-day MA | $16.91 | Market Cap | 184.71M |
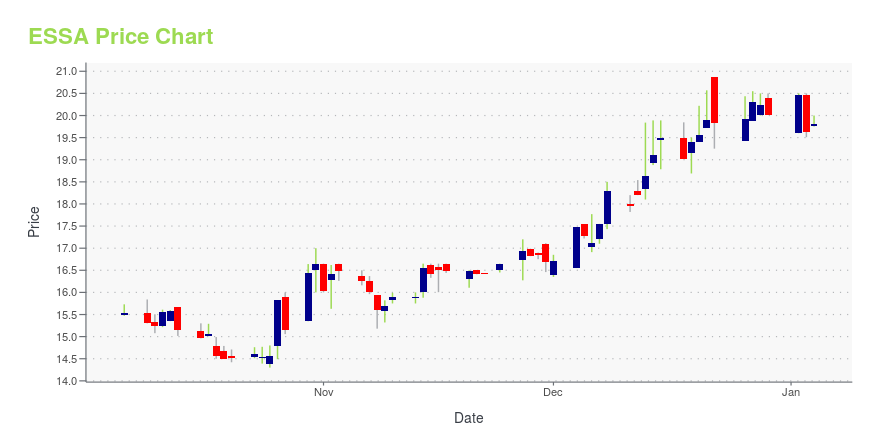
ESSA Stock Price Chart Interactive Chart >
ESSA POWR Grades
- ESSA scores best on the Sentiment dimension, with a Sentiment rank ahead of 91.75% of US stocks.
- The strongest trend for ESSA is in Stability, which has been heading down over the past 26 weeks.
- ESSA ranks lowest in Quality; there it ranks in the 9th percentile.
ESSA Stock Summary
- The ratio of debt to operating expenses for ESSA BANCORP INC is higher than it is for about 89.55% of US stocks.
- Equity multiplier, or assets relative to shareholders' equity, comes in at 9.61 for ESSA BANCORP INC; that's greater than it is for 89.03% of US stocks.
- Shareholder yield, a measure of how much is returned to shareholders via dividends and share repurchases, for ESSA comes in at -66.77% -- higher than that of just 6.28% of stocks in our set.
- Stocks that are quantitatively similar to ESSA, based on their financial statements, market capitalization, and price volatility, are SBSI, TBNK, DCOM, BRKL, and IROQ.
- ESSA's SEC filings can be seen here. And to visit ESSA BANCORP INC's official web site, go to ir.essabank.com.
ESSA Valuation Summary
- In comparison to the median Financial Services stock, ESSA's price/sales ratio is 141.67% higher, now standing at 2.9.
- ESSA's price/sales ratio has moved down 6 over the prior 204 months.
Below are key valuation metrics over time for ESSA.
Stock | Date | P/S | P/B | P/E | EV/EBIT |
---|---|---|---|---|---|
ESSA | 2023-12-22 | 2.9 | 0.9 | 10.8 | 21.5 |
ESSA | 2023-12-21 | 2.9 | 0.9 | 10.9 | 21.6 |
ESSA | 2023-12-20 | 2.9 | 0.9 | 10.7 | 21.4 |
ESSA | 2023-12-19 | 2.9 | 0.9 | 10.6 | 21.3 |
ESSA | 2023-12-18 | 2.8 | 0.9 | 10.4 | 21.2 |
ESSA | 2023-12-15 | 2.9 | 0.9 | 10.6 | 21.4 |
ESSA Growth Metrics
- Its 2 year net income to common stockholders growth rate is now at 26.39%.
- The 5 year cash and equivalents growth rate now stands at 363.42%.
- The 3 year price growth rate now stands at 3.74%.
The table below shows ESSA's growth in key financial areas (numbers in millions of US dollars).
Date | Revenue | Operating Cash Flow | Net Income to Common Stock |
---|---|---|---|
2022-12-31 | 69.816 | 22.195 | 20.323 |
2022-09-30 | 68.281 | 22.707 | 20.07 |
2022-06-30 | 65.21 | 21.225 | 18.167 |
2022-03-31 | 62.951 | 19.405 | 17.154 |
2021-12-31 | 62.43 | 19.081 | 16.902 |
2021-09-30 | 61.687 | 19.375 | 16.424 |
ESSA Price Target
For more insight on analysts targets of ESSA, see our ESSA price target page. And for a list of of all stocks sorted by upside potential based on analyst target price, see our Top Price Target page.
Average Price Target | $18.00 | Average Broker Recommendation | 2 (Hold) |
ESSA Bancorp, Inc. - common stock (ESSA) Company Bio
ESSA Bancorp, Inc. provides a range of financial services to individuals, families, and businesses in Pennsylvania. The company was founded in 1916 and is based in Stroudsburg, Pennsylvania.
Latest ESSA News From Around the Web
Below are the latest news stories about ESSA BANCORP INC that investors may wish to consider to help them evaluate ESSA as an investment opportunity.
ESSA Bancorp Full Year 2023 Earnings: Beats ExpectationsESSA Bancorp ( NASDAQ:ESSA ) Full Year 2023 Results Key Financial Results Revenue: US$68.8m (flat on FY 2022). Net... |
ESSA Bancorp's (NASDAQ:ESSA) Dividend Will Be $0.15The board of ESSA Bancorp, Inc. ( NASDAQ:ESSA ) has announced that it will pay a dividend on the 29th of December, with... |
ESSA Bancorp (NASDAQ:ESSA) Is Due To Pay A Dividend Of $0.15ESSA Bancorp, Inc.'s ( NASDAQ:ESSA ) investors are due to receive a payment of $0.15 per share on 29th of December... |
ESSA Bancorp, Inc. Declares Quarterly DividendSTROUDSBURG, PA / ACCESSWIRE / November 15, 2023 / ESSA Bancorp, Inc. (NASDAQ:ESSA), the holding company for ESSA Bank & Trust, today announced that its Board of Directors declared a dividend of fifteen cents ($0.15) per share. The dividend is payable ... |
ESSA Bancorp Inc (ESSA) Announces Fiscal Fourth Quarter and Full Year 2023 Financial ResultsNet income for the year stands at $18.6 million with a strong financial performance despite a challenging interest rate environment |
ESSA Price Returns
1-mo | 6.51% |
3-mo | -8.17% |
6-mo | 23.48% |
1-year | 21.16% |
3-year | 22.09% |
5-year | 38.19% |
YTD | -8.17% |
2023 | -0.52% |
2022 | 24.06% |
2021 | 18.90% |
2020 | -8.59% |
2019 | 11.37% |
ESSA Dividends
Ex-Dividend Date | Type | Payout Amount | Change | ||||||
---|---|---|---|---|---|---|---|---|---|
Loading, please wait... |
Continue Researching ESSA
Here are a few links from around the web to help you further your research on ESSA Bancorp Inc's stock as an investment opportunity:ESSA Bancorp Inc (ESSA) Stock Price | Nasdaq
ESSA Bancorp Inc (ESSA) Stock Quote, History and News - Yahoo Finance
ESSA Bancorp Inc (ESSA) Stock Price and Basic Information | MarketWatch
Loading social stream, please wait...