
ESSA Bancorp, Inc. - common stock (ESSA): Price and Financial Metrics
ESSA Price/Volume Stats
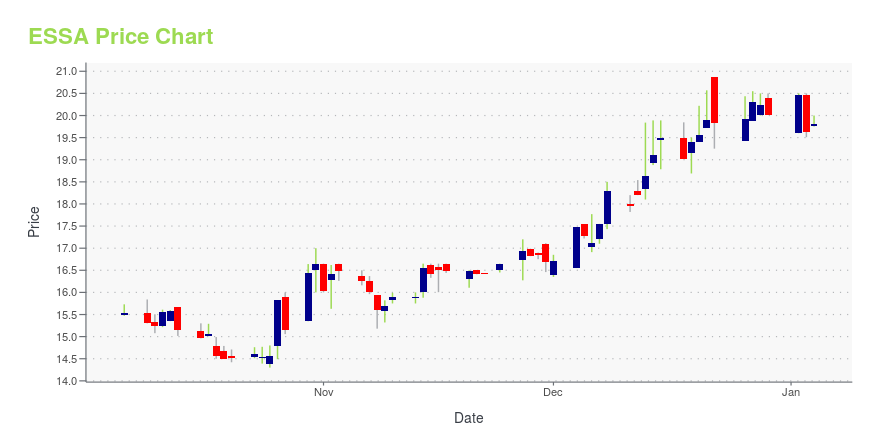
| Current price | $20.18 | 52-week high | $20.87 |
| Prev. close | $20.14 | 52-week low | $14.30 |
| Day low | $19.79 | Volume | 12,526 |
| Day high | $20.18 | Avg. volume | 13,203 |
| 50-day MA | $17.66 | Dividend yield | 2.98% |
| 200-day MA | $17.55 | Market Cap | 204.46M |
ESSA Stock Price Chart Interactive Chart >
ESSA Bancorp, Inc. - common stock (ESSA) Company Bio
ESSA Bancorp, Inc. provides a range of financial services to individuals, families, and businesses in Pennsylvania. The company was founded in 1916 and is based in Stroudsburg, Pennsylvania.
Latest ESSA News From Around the Web
Below are the latest news stories about ESSA BANCORP INC that investors may wish to consider to help them evaluate ESSA as an investment opportunity.
ESSA Bancorp Full Year 2023 Earnings: Beats ExpectationsESSA Bancorp ( NASDAQ:ESSA ) Full Year 2023 Results Key Financial Results Revenue: US$68.8m (flat on FY 2022). Net... |
ESSA Bancorp's (NASDAQ:ESSA) Dividend Will Be $0.15The board of ESSA Bancorp, Inc. ( NASDAQ:ESSA ) has announced that it will pay a dividend on the 29th of December, with... |
ESSA Bancorp (NASDAQ:ESSA) Is Due To Pay A Dividend Of $0.15ESSA Bancorp, Inc.'s ( NASDAQ:ESSA ) investors are due to receive a payment of $0.15 per share on 29th of December... |
ESSA Bancorp, Inc. Declares Quarterly DividendSTROUDSBURG, PA / ACCESSWIRE / November 15, 2023 / ESSA Bancorp, Inc. (NASDAQ:ESSA), the holding company for ESSA Bank & Trust, today announced that its Board of Directors declared a dividend of fifteen cents ($0.15) per share. The dividend is payable ... |
ESSA Bancorp Inc (ESSA) Announces Fiscal Fourth Quarter and Full Year 2023 Financial ResultsNet income for the year stands at $18.6 million with a strong financial performance despite a challenging interest rate environment |
ESSA Price Returns
| 1-mo | 24.18% |
| 3-mo | 22.66% |
| 6-mo | 0.90% |
| 1-year | 24.99% |
| 3-year | 36.09% |
| 5-year | 54.26% |
| YTD | 2.57% |
| 2023 | -0.53% |
| 2022 | 24.06% |
| 2021 | 18.90% |
| 2020 | -8.59% |
| 2019 | 11.37% |
ESSA Dividends
| Ex-Dividend Date | Type | Payout Amount | Change | ||||||
|---|---|---|---|---|---|---|---|---|---|
| Loading, please wait... | |||||||||
Continue Researching ESSA
Here are a few links from around the web to help you further your research on ESSA Bancorp Inc's stock as an investment opportunity:ESSA Bancorp Inc (ESSA) Stock Price | Nasdaq
ESSA Bancorp Inc (ESSA) Stock Quote, History and News - Yahoo Finance
ESSA Bancorp Inc (ESSA) Stock Price and Basic Information | MarketWatch
Loading social stream, please wait...