
Energy Transfer LP (ET): Price and Financial Metrics
ET Price/Volume Stats
| Current price | $16.27 | 52-week high | $16.50 |
| Prev. close | $16.13 | 52-week low | $12.46 |
| Day low | $16.07 | Volume | 22,057,371 |
| Day high | $16.31 | Avg. volume | 12,707,947 |
| 50-day MA | $15.89 | Dividend yield | 7.74% |
| 200-day MA | $14.81 | Market Cap | 54.83B |
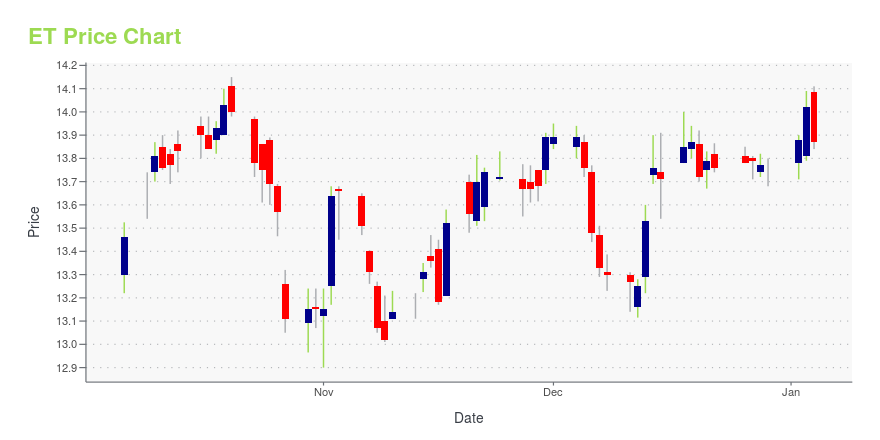
ET Stock Price Chart Interactive Chart >
Energy Transfer LP (ET) Company Bio
Energy Transfer LP is an American company engaged in natural gas and propane pipeline transport. It is organized under Delaware state laws and headquartered in Dallas, Texas. It was founded in 1995 by Ray Davis and Kelcy Warren, who remains Chairman and CEO. It owns a 36.4% interest in Dakota Access, LLC, the company responsible for developing the Dakota Access Pipeline. (Source:Wikipedia)
Latest ET News From Around the Web
Below are the latest news stories about ENERGY TRANSFER LP that investors may wish to consider to help them evaluate ET as an investment opportunity.
Down 50% Over the Past Year, Is This Energy Stock Now a Screaming Bargain?Tellurian faces an uphill battle to complete a key project. |
My 4 Favorite Ultra-High-Yield Dividend Stocks to Buy for 2024These dividend stocks could make 2024 a truly happy new year for income investors. |
Energy Transfer Accused of Boxing Out Louisiana Pipeline Rivals(Bloomberg) -- A natural gas pipeline developer is accusing Energy Transfer LP of “anticompetitive” behavior after the company denied three projects from crossing its pipelines in Louisiana, sparking a legal battle affecting more than than $2 billion of energy infrastructure.Most Read from BloombergManchester United Saga Ends With $1.3 Billion Ratcliffe DealTrump Tells Appeals Panel He Should Have ‘Absolute Immunity’US Accuses Iran of Indian Ocean Attack as Shipping Threat GrowsNigeria Seeks Con |
Does The Energy Sector Have The Energy To Offer Good Investments?While some companies have struggled in recent years, there are opportunities for growth and attractive valuations. |
Wall Street Bulls Look Optimistic About Energy Transfer LP (ET): Should You Buy?The average brokerage recommendation (ABR) for Energy Transfer LP (ET) is equivalent to a Buy. The overly optimistic recommendations of Wall Street analysts make the effectiveness of this highly sought-after metric questionable. So, is it worth buying the stock? |
ET Price Returns
| 1-mo | 2.20% |
| 3-mo | 3.97% |
| 6-mo | 17.34% |
| 1-year | 35.39% |
| 3-year | 113.56% |
| 5-year | 75.99% |
| YTD | 22.95% |
| 2023 | 27.88% |
| 2022 | 55.74% |
| 2021 | 42.99% |
| 2020 | -44.92% |
| 2019 | 5.88% |
ET Dividends
| Ex-Dividend Date | Type | Payout Amount | Change | ||||||
|---|---|---|---|---|---|---|---|---|---|
| Loading, please wait... | |||||||||
Continue Researching ET
Want to see what other sources are saying about Energy Transfer LP's financials and stock price? Try the links below:Energy Transfer LP (ET) Stock Price | Nasdaq
Energy Transfer LP (ET) Stock Quote, History and News - Yahoo Finance
Energy Transfer LP (ET) Stock Price and Basic Information | MarketWatch
Loading social stream, please wait...