
Evertec, Inc. (EVTC): Price and Financial Metrics
EVTC Price/Volume Stats
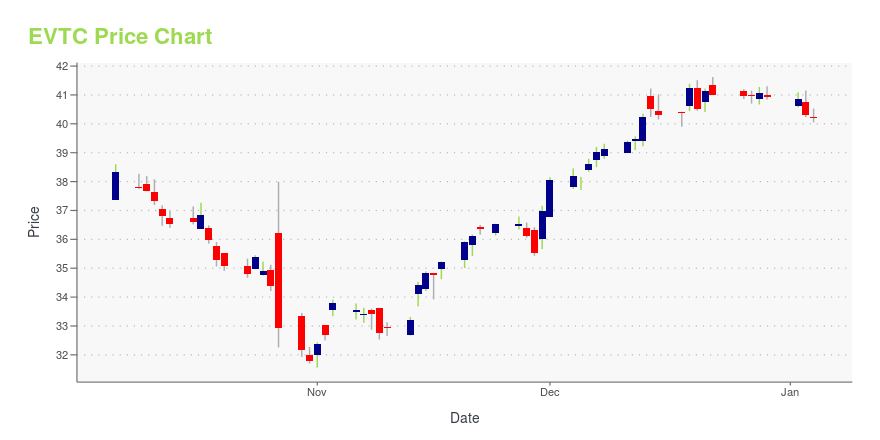
| Current price | $34.91 | 52-week high | $42.21 |
| Prev. close | $34.09 | 52-week low | $28.76 |
| Day low | $34.33 | Volume | 317,736 |
| Day high | $35.01 | Avg. volume | 397,752 |
| 50-day MA | $34.02 | Dividend yield | 0.57% |
| 200-day MA | $37.04 | Market Cap | 2.25B |
EVTC Stock Price Chart Interactive Chart >
Evertec, Inc. (EVTC) Company Bio
Evertec provides various transaction processing services to financial institutions, merchants, corporations, and government agencies in Latin America and the Caribbean. The company was founded in 2004 and is based in San Juan, Puerto Rico.
Latest EVTC News From Around the Web
Below are the latest news stories about EVERTEC INC that investors may wish to consider to help them evaluate EVTC as an investment opportunity.
EVERTEC Closes on the Acquisition of Sinqia, a Leading Provider of Software Solutions for Financial Institutions in BrazilSAN JUAN, Puerto Rico, November 01, 2023--EVERTEC, Inc. (NYSE: EVTC) ("Evertec", the "Company", "we" or "our") today announced that the Company has closed the previously announced transaction to acquire Sinqia, S.A. ("Sinqia"), a leading player in the market of software for financial services in Brazil. |
The Evertec Inc (EVTC) Company: A Short SWOT AnalysisUnveiling the Strengths, Weaknesses, Opportunities, and Threats of a Leading Transaction Processing Business in Latin America and the Caribbean |
EVERTEC, Inc. (NYSE:EVTC) Q3 2023 Earnings Call TranscriptEVERTEC, Inc. (NYSE:EVTC) Q3 2023 Earnings Call Transcript October 26, 2023 EVERTEC, Inc. beats earnings expectations. Reported EPS is $0.8, expectations were $0.66. Operator: Hello, and welcome to the EVERTEC Third Quarter 2023 Earnings Conference Call. [Operator Instructions] Please note, today’s event is being recorded. I will now turn the conference over to Beatriz Brown-Sáenz […] |
Here's What Key Metrics Tell Us About Evertec (EVTC) Q3 EarningsThe headline numbers for Evertec (EVTC) give insight into how the company performed in the quarter ended September 2023, but it may be worthwhile to compare some of its key metrics to Wall Street estimates and the year-ago actuals. |
Evertec Inc (EVTC) Reports Q3 2023 Earnings, Raises Annual GuidanceRevenue increases by 19% while GAAP Net Income decreases by 93% |
EVTC Price Returns
| 1-mo | 3.50% |
| 3-mo | -9.16% |
| 6-mo | -13.63% |
| 1-year | -11.87% |
| 3-year | -17.64% |
| 5-year | 14.37% |
| YTD | -14.51% |
| 2023 | 27.14% |
| 2022 | -34.88% |
| 2021 | 27.72% |
| 2020 | 16.28% |
| 2019 | 19.37% |
EVTC Dividends
| Ex-Dividend Date | Type | Payout Amount | Change | ||||||
|---|---|---|---|---|---|---|---|---|---|
| Loading, please wait... | |||||||||
Continue Researching EVTC
Here are a few links from around the web to help you further your research on EVERTEC Inc's stock as an investment opportunity:EVERTEC Inc (EVTC) Stock Price | Nasdaq
EVERTEC Inc (EVTC) Stock Quote, History and News - Yahoo Finance
EVERTEC Inc (EVTC) Stock Price and Basic Information | MarketWatch
Loading social stream, please wait...