
East West Bancorp, Inc. (EWBC): Price and Financial Metrics
EWBC Price/Volume Stats
| Current price | $87.97 | 52-week high | $88.51 |
| Prev. close | $87.01 | 52-week low | $49.59 |
| Day low | $87.02 | Volume | 862,600 |
| Day high | $88.51 | Avg. volume | 1,045,881 |
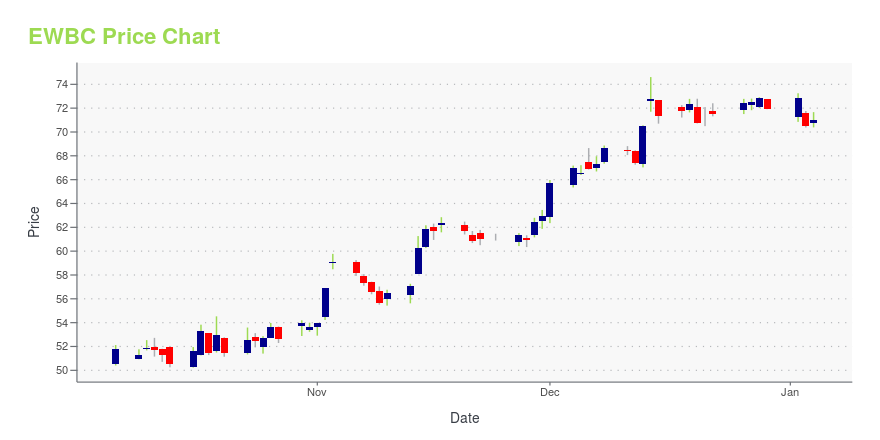
| 50-day MA | $74.83 | Dividend yield | 2.63% |
| 200-day MA | $70.54 | Market Cap | 12.24B |
EWBC Stock Price Chart Interactive Chart >
East West Bancorp, Inc. (EWBC) Company Bio
East West Bancorp offers deposit products, including the traditional range of personal and business checking and savings accounts, time deposits and individual retirement accounts, and merchant services in the U.S., China, and Hong Kong. The company was founded in 1998 and is based in Pasadena, California.
Latest EWBC News From Around the Web
Below are the latest news stories about EAST WEST BANCORP INC that investors may wish to consider to help them evaluate EWBC as an investment opportunity.
East West Bancorp Announces Dates for 2023 Fourth Quarter and 2024 First Quarter Earnings CallsPASADENA, Calif., December 21, 2023--East West Bancorp, Inc. ("East West" or the "Company") (Nasdaq: EWBC), announced plans to host conference calls to review financial results on the following dates: |
Why This 1 Momentum Stock Could Be a Great Addition to Your PortfolioWondering how to pick strong, market-beating stocks for your investment portfolio? Look no further than the Zacks Style Scores. |
Why East West Bancorp (EWBC) is a Top Value Stock for the Long-TermWhether you're a value, growth, or momentum investor, finding strong stocks becomes easier with the Zacks Style Scores, a top feature of the Zacks Premium research service. |
East West Bancorp (EWBC) Rides on Rates, Weak Asset Quality AilsDecent loan demand, a strong balance sheet position and higher rates are likely to aid East West Bancorp's financials amid mounting expenses and poor asset quality. |
Insider Sell Alert: Director Molly Campbell Sells Shares of East West Bancorp Inc (EWBC)East West Bancorp Inc (NASDAQ:EWBC), a prominent player in the financial sector, has recently witnessed a notable insider transaction. |
EWBC Price Returns
| 1-mo | 22.35% |
| 3-mo | 16.63% |
| 6-mo | 20.21% |
| 1-year | 48.20% |
| 3-year | 33.39% |
| 5-year | 103.67% |
| YTD | 24.10% |
| 2023 | 12.75% |
| 2022 | -14.44% |
| 2021 | 57.98% |
| 2020 | 7.23% |
| 2019 | 14.34% |
EWBC Dividends
| Ex-Dividend Date | Type | Payout Amount | Change | ||||||
|---|---|---|---|---|---|---|---|---|---|
| Loading, please wait... | |||||||||
Continue Researching EWBC
Want to do more research on East West Bancorp Inc's stock and its price? Try the links below:East West Bancorp Inc (EWBC) Stock Price | Nasdaq
East West Bancorp Inc (EWBC) Stock Quote, History and News - Yahoo Finance
East West Bancorp Inc (EWBC) Stock Price and Basic Information | MarketWatch
Loading social stream, please wait...