
Eagle Materials Inc (EXP): Price and Financial Metrics
EXP Price/Volume Stats
| Current price | $246.07 | 52-week high | $276.61 |
| Prev. close | $235.62 | 52-week low | $145.03 |
| Day low | $239.43 | Volume | 597,857 |
| Day high | $248.19 | Avg. volume | 313,924 |
| 50-day MA | $229.59 | Dividend yield | 0.42% |
| 200-day MA | $221.12 | Market Cap | 8.33B |
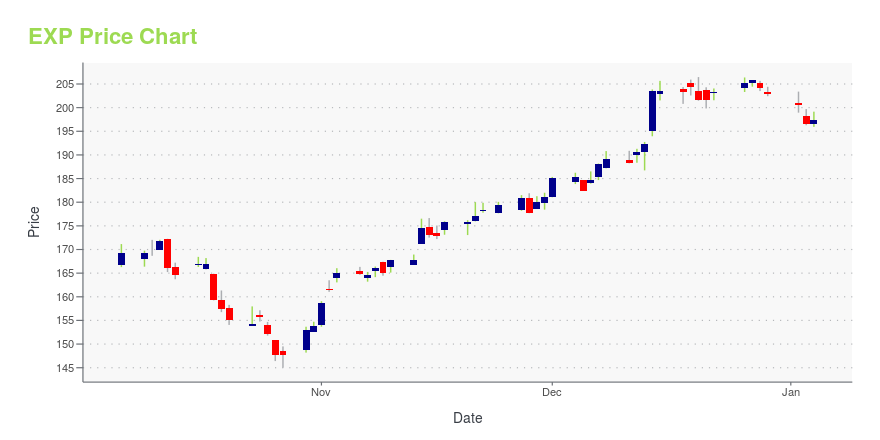
EXP Stock Price Chart Interactive Chart >
Eagle Materials Inc (EXP) Company Bio
Eagle Materials produces and sells construction products and building materials used in residential, industrial, commercial, and infrastructure construction, and products used in oil and natural gas extraction in the United States. The company was founded in 1963 and is based in Dallas, Texas.
Latest EXP News From Around the Web
Below are the latest news stories about EAGLE MATERIALS INC that investors may wish to consider to help them evaluate EXP as an investment opportunity.
Eagle Materials (EXP) Rises Higher Than Market: Key FactsIn the latest trading session, Eagle Materials (EXP) closed at $205.80, marking a +0.33% move from the previous day. |
Eagle Materials (EXP) Ascends But Remains Behind Market: Some Facts to NoteThe latest trading day saw Eagle Materials (EXP) settling at $204.26, representing a +0.47% change from its previous close. |
Should You Hold Eagle Materials (EXP)?ClearBridge Investments, an investment management company, released its “ClearBridge Small Cap Value Strategy” third quarter 2023 investor letter. A copy of the same can be downloaded here. The strategy outperformed the benchmark Russell 2000 Value Index in the third quarter. The strategy generated gains across three of the 11 sectors in which it was invested during […] |
Eagle Materials (EXP) Stock Drops Despite Market Gains: Important Facts to NoteEagle Materials (EXP) closed the most recent trading day at $203.31, moving -0.12% from the previous trading session. |
Eagle Materials Inc. (NYSE:EXP) Looks Inexpensive But Perhaps Not Attractive EnoughWith a price-to-earnings (or "P/E") ratio of 14.5x Eagle Materials Inc. ( NYSE:EXP ) may be sending bullish signals at... |
EXP Price Returns
| 1-mo | 14.68% |
| 3-mo | -4.04% |
| 6-mo | 14.21% |
| 1-year | 34.91% |
| 3-year | 87.87% |
| 5-year | 182.84% |
| YTD | 21.57% |
| 2023 | 53.62% |
| 2022 | -19.55% |
| 2021 | 65.07% |
| 2020 | 11.98% |
| 2019 | 49.23% |
EXP Dividends
| Ex-Dividend Date | Type | Payout Amount | Change | ||||||
|---|---|---|---|---|---|---|---|---|---|
| Loading, please wait... | |||||||||
Continue Researching EXP
Want to see what other sources are saying about Eagle Materials Inc's financials and stock price? Try the links below:Eagle Materials Inc (EXP) Stock Price | Nasdaq
Eagle Materials Inc (EXP) Stock Quote, History and News - Yahoo Finance
Eagle Materials Inc (EXP) Stock Price and Basic Information | MarketWatch
Loading social stream, please wait...