Exponent, Inc. (EXPO): Price and Financial Metrics
GET POWR RATINGS... FREE!
EXPO POWR Grades
- EXPO scores best on the Quality dimension, with a Quality rank ahead of 90.59% of US stocks.
- The strongest trend for EXPO is in Quality, which has been heading down over the past 178 days.
- EXPO ranks lowest in Value; there it ranks in the 4th percentile.
EXPO Stock Summary
- With a one year PEG ratio of 934.97, EXPONENT INC is expected to have a higher PEG ratio (a measure of how expensive a stock is relative to its expected earnings growth) than 96.87% of US stocks.
- Price to trailing twelve month operating cash flow for EXPO is currently 51.85, higher than 92.11% of US stocks with positive operating cash flow.
- The volatility of EXPONENT INC's share price is greater than that of just 8.88% US stocks with at least 200 days of trading history.
- If you're looking for stocks that are quantitatively similar to EXPONENT INC, a group of peers worth examining would be AIU, PGNY, TWKS, OWL, and CLEU.
- EXPO's SEC filings can be seen here. And to visit EXPONENT INC's official web site, go to www.exponent.com.
EXPO Valuation Summary
- EXPO's price/sales ratio is 9.5; this is 427.78% higher than that of the median Industrials stock.
- EXPO's EV/EBIT ratio has moved up 29.9 over the prior 243 months.
Below are key valuation metrics over time for EXPO.
Stock | Date | P/S | P/B | P/E | EV/EBIT |
---|---|---|---|---|---|
EXPO | 2023-03-17 | 9.5 | 15.2 | 47.5 | 35.7 |
EXPO | 2023-03-16 | 9.7 | 15.6 | 48.7 | 36.6 |
EXPO | 2023-03-15 | 10.2 | 16.3 | 51.2 | 38.5 |
EXPO | 2023-03-14 | 10.3 | 16.5 | 51.8 | 39.0 |
EXPO | 2023-03-13 | 10.0 | 15.9 | 50.0 | 37.6 |
EXPO | 2023-03-10 | 9.9 | 15.8 | 49.5 | 37.2 |
EXPO Growth Metrics
- The 2 year net income to common stockholders growth rate now stands at 16.2%.
- The 2 year cash and equivalents growth rate now stands at 103.66%.
- The 2 year revenue growth rate now stands at 12.77%.

The table below shows EXPO's growth in key financial areas (numbers in millions of US dollars).
Date | Revenue | Operating Cash Flow | Net Income to Common Stock |
---|---|---|---|
2022-09-30 | 499.444 | 107.427 | 100.186 |
2022-06-30 | 488.67 | 102.932 | 100.318 |
2022-03-31 | 478.266 | 116.931 | 99.963 |
2021-12-31 | 466.269 | 124.568 | 101.202 |
2021-09-30 | 456.002 | 111.243 | 102.662 |
2021-06-30 | 438.26 | 114.565 | 96.172 |
EXPO's Quality Factors
The “Quality” component of the POWR Ratings focuses on 31 different factors of a companies fundamentals and operational strength. Here are some key insights as we drill into the specifics of these quality attributes.- EXPO has a Quality Grade of B, ranking ahead of 91.61% of graded US stocks.
- EXPO's asset turnover comes in at 0.759 -- ranking 200th of 563 Business Services stocks.
- TCX, APPF, and VRNS are the stocks whose asset turnover ratios are most correlated with EXPO.
The table below shows EXPO's key quality metrics over time.
Period | Asset Turnover | Gross Margin | ROIC |
---|---|---|---|
2021-07-02 | 0.759 | 0.234 | 0.415 |
2021-04-02 | 0.745 | 0.200 | 0.363 |
2021-01-01 | 0.758 | 0.240 | 0.342 |
2020-10-02 | 0.777 | 0.254 | 0.341 |
2020-07-03 | 0.779 | 0.265 | 0.325 |
2020-04-03 | 0.803 | 0.299 | 0.334 |
EXPO Price Target
For more insight on analysts targets of EXPO, see our EXPO price target page. And for a list of of all stocks sorted by upside potential based on analyst target price, see our Top Price Target page.
Average Price Target | $115.00 | Average Broker Recommendation | 1.67 (Moderate Buy) |
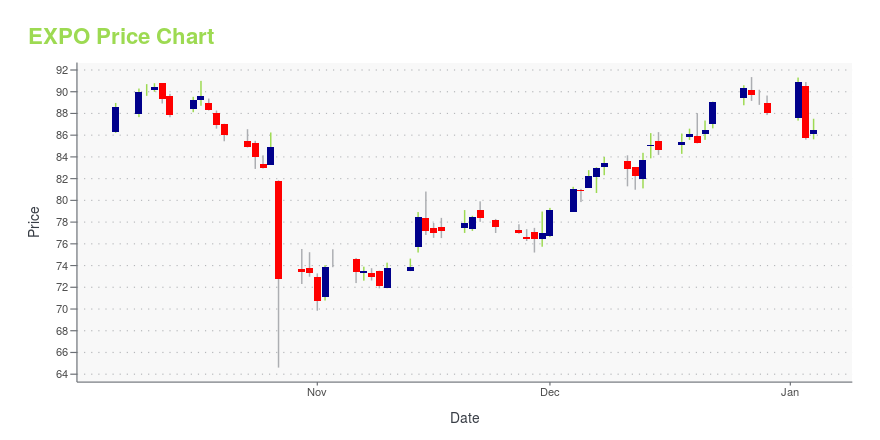
EXPO Stock Price Chart Interactive Chart >
EXPO Price/Volume Stats
Current price | $97.38 | 52-week high | $112.75 |
Prev. close | $96.04 | 52-week low | $80.97 |
Day low | $96.22 | Volume | 565,300 |
Day high | $98.18 | Avg. volume | 196,891 |
50-day MA | $103.04 | Dividend yield | 1.06% |
200-day MA | $96.94 | Market Cap | 4.93B |
Exponent, Inc. (EXPO) Company Bio
Exponent provides engineering and scientific consulting services worldwide. It operates in two segments, Engineering and Other Scientific; and Environmental and Health. The company was founded in 1967 and is based in Menlo Park, California.
Latest EXPO News From Around the Web
Below are the latest news stories about EXPONENT INC that investors may wish to consider to help them evaluate EXPO as an investment opportunity.
Exponent Set to Join S&P MidCap 400; CVR Energy and Certara to Join S&P SmallCap 600S&P Dow Jones Indices will make the following changes to the S&P MidCap 400 and S&P SmallCap 600: |
Exponent, Inc. (NASDAQ:EXPO) Passed Our Checks, And It's About To Pay A US$0.26 DividendExponent, Inc. ( NASDAQ:EXPO ) stock is about to trade ex-dividend in 4 days. The ex-dividend date is usually set to be... |
Exponent (NASDAQ:EXPO) Has Announced That It Will Be Increasing Its Dividend To $0.26Exponent, Inc. ( NASDAQ:EXPO ) has announced that it will be increasing its dividend from last year's comparable... |
Exponent's (NASDAQ:EXPO) Shareholders Will Receive A Bigger Dividend Than Last YearExponent, Inc. ( NASDAQ:EXPO ) will increase its dividend from last year's comparable payment on the 24th of March to... |
Exponent, Inc. (NASDAQ:EXPO) Q4 2022 Earnings Call TranscriptExponent, Inc. (NASDAQ:EXPO) Q4 2022 Earnings Call Transcript February 2, 2023 Operator: Good day, and welcome to Exponent’s Fourth Quarter and Fiscal Year 2022 Financial Results Conference Call. All participants will be in listen only mode . Please note this event is being recorded. I would now like to turn the conference over to Joni […] |
EXPO Price Returns
1-mo | -10.27% |
3-mo | -3.21% |
6-mo | 9.69% |
1-year | -2.91% |
3-year | 66.26% |
5-year | 162.53% |
YTD | -1.48% |
2022 | -14.25% |
2021 | 30.67% |
2020 | 31.74% |
2019 | 37.51% |
2018 | 44.04% |
EXPO Dividends
Ex-Dividend Date | Type | Payout Amount | Change | ||||||
---|---|---|---|---|---|---|---|---|---|
Loading, please wait... |
Continue Researching EXPO
Want to do more research on Exponent Inc's stock and its price? Try the links below:Exponent Inc (EXPO) Stock Price | Nasdaq
Exponent Inc (EXPO) Stock Quote, History and News - Yahoo Finance
Exponent Inc (EXPO) Stock Price and Basic Information | MarketWatch
Loading social stream, please wait...