
Extreme Networks, Inc. (EXTR): Price and Financial Metrics
EXTR Price/Volume Stats
| Current price | $13.93 | 52-week high | $32.73 |
| Prev. close | $13.73 | 52-week low | $10.49 |
| Day low | $13.67 | Volume | 1,086,200 |
| Day high | $14.02 | Avg. volume | 2,154,582 |
| 50-day MA | $12.51 | Dividend yield | N/A |
| 200-day MA | $14.30 | Market Cap | 1.81B |
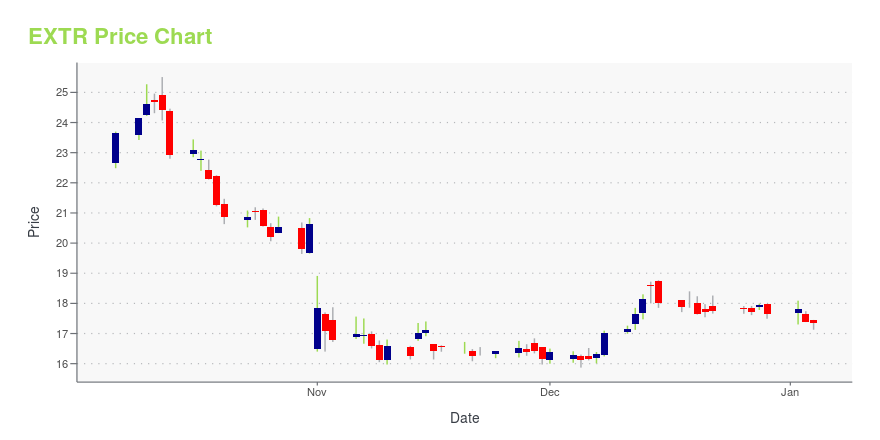
EXTR Stock Price Chart Interactive Chart >
Extreme Networks, Inc. (EXTR) Company Bio
Extreme Networks, Inc. provides wired and wireless network infrastructure equipment, software, and services for enterprises, data centers, and service providers. The company was founded in 1996 and is based in San Jose, California.
Latest EXTR News From Around the Web
Below are the latest news stories about EXTREME NETWORKS INC that investors may wish to consider to help them evaluate EXTR as an investment opportunity.
Here's Why Extreme Networks (EXTR) Gained But Lagged the Market TodayExtreme Networks (EXTR) closed the most recent trading day at $17.73, moving +0.51% from the previous trading session. |
Extreme Networks Appoints Monica Kumar as Chief Marketing OfficerMORRISVILLE, N.C., December 20, 2023--Extreme Networks today announced that Monica Kumar has been appointed as the company’s new Executive Vice President and Chief Marketing Officer. |
Extreme Networks (EXTR) Stock Dips While Market Gains: Key FactsIn the most recent trading session, Extreme Networks (EXTR) closed at $17.89, indicating a -0.61% shift from the previous trading day. |
7 Tech Stocks to Light Up Your Portfolio This Holiday SeasonAs the holiday season approaches, the tech stock market shines brightly, with innovative sparks illuminating various sectors. |
Why the Market Dipped But Extreme Networks (EXTR) Gained TodayIn the most recent trading session, Extreme Networks (EXTR) closed at $16.14, indicating a +0.19% shift from the previous trading day. |
EXTR Price Returns
| 1-mo | 6.83% |
| 3-mo | 20.09% |
| 6-mo | -18.30% |
| 1-year | -49.05% |
| 3-year | 42.14% |
| 5-year | 94.55% |
| YTD | -21.03% |
| 2023 | -3.66% |
| 2022 | 16.62% |
| 2021 | 127.87% |
| 2020 | -6.51% |
| 2019 | 20.82% |
Continue Researching EXTR
Want to do more research on Extreme Networks Inc's stock and its price? Try the links below:Extreme Networks Inc (EXTR) Stock Price | Nasdaq
Extreme Networks Inc (EXTR) Stock Quote, History and News - Yahoo Finance
Extreme Networks Inc (EXTR) Stock Price and Basic Information | MarketWatch
Loading social stream, please wait...