
Diamondback Energy Inc. (FANG): Price and Financial Metrics
FANG Price/Volume Stats
| Current price | $136.16 | 52-week high | $214.50 |
| Prev. close | $135.54 | 52-week low | $114.00 |
| Day low | $135.11 | Volume | 2,054,400 |
| Day high | $137.81 | Avg. volume | 2,658,152 |
| 50-day MA | $146.97 | Dividend yield | 2.93% |
| 200-day MA | $172.67 | Market Cap | 40.04B |
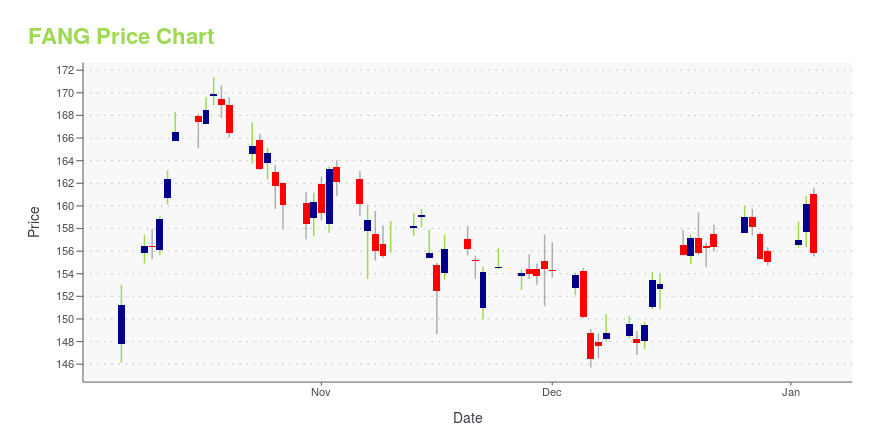
FANG Stock Price Chart Interactive Chart >
Diamondback Energy Inc. (FANG) Company Bio
Diamondback Energy is a company engaged in hydrocarbon exploration headquartered in Midland, Texas. (Source:Wikipedia)
FANG Price Returns
| 1-mo | -15.74% |
| 3-mo | -20.86% |
| 6-mo | -25.26% |
| 1-year | -31.38% |
| 3-year | 27.64% |
| 5-year | 374.00% |
| YTD | -16.30% |
| 2024 | 10.35% |
| 2023 | 19.66% |
| 2022 | 35.34% |
| 2021 | 127.51% |
| 2020 | -46.00% |
FANG Dividends
| Ex-Dividend Date | Type | Payout Amount | Change | ||||||
|---|---|---|---|---|---|---|---|---|---|
| Loading, please wait... | |||||||||
Continue Researching FANG
Want to do more research on Diamondback Energy Inc's stock and its price? Try the links below:Diamondback Energy Inc (FANG) Stock Price | Nasdaq
Diamondback Energy Inc (FANG) Stock Quote, History and News - Yahoo Finance
Diamondback Energy Inc (FANG) Stock Price and Basic Information | MarketWatch
Loading social stream, please wait...