Diamondback Energy Inc. (FANG): Price and Financial Metrics

Diamondback Energy Inc. (FANG): $154.27

0.14 (-0.09%)

POWR Rating

Component Grades

Momentum

C

Stability

C

Sentiment

Quality

B

Add FANG to Watchlist
Sign Up

Industry: Energy - Oil & Gas

Industry

D

Ranked

#39 of 85

in industry

FANG Price/Volume Stats

Current price $154.27 52-week high $171.40
Prev. close $154.41 52-week low $119.01
Day low $153.66 Volume 1,353,900
Day high $156.77 Avg. volume 2,043,888
50-day MA $157.79 Dividend yield 2.18%
200-day MA $143.75 Market Cap 27.61B

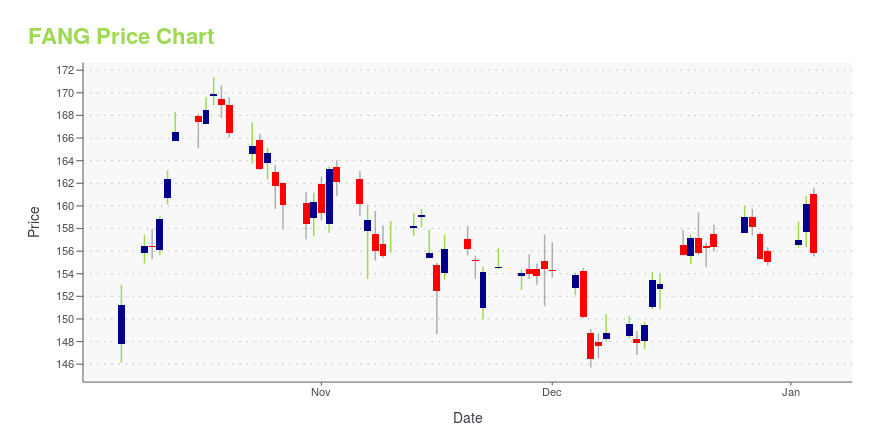
FANG Stock Price Chart Interactive Chart >

FANG POWR Grades

  • FANG scores best on the Quality dimension, with a Quality rank ahead of 91.8% of US stocks.
  • The strongest trend for FANG is in Growth, which has been heading up over the past 177 days.
  • FANG ranks lowest in Value; there it ranks in the 11th percentile.

FANG Stock Summary

  • DIAMONDBACK ENERGY INC's market capitalization of $28,227,710,314 is ahead of 92.2% of US-listed equities.
  • Of note is the ratio of DIAMONDBACK ENERGY INC's sales and general administrative expense to its total operating expenses; just 2.62% of US stocks have a lower such ratio.
  • Revenue growth over the past 12 months for DIAMONDBACK ENERGY INC comes in at -14.75%, a number that bests just 17.2% of the US stocks we're tracking.
  • Stocks with similar financial metrics, market capitalization, and price volatility to DIAMONDBACK ENERGY INC are AVB, DVN, MRO, ET, and ORAN.
  • FANG's SEC filings can be seen here. And to visit DIAMONDBACK ENERGY INC's official web site, go to www.diamondbackenergy.com.

FANG Valuation Summary

  • FANG's price/sales ratio is 3.4; this is 161.54% higher than that of the median Energy stock.
  • Over the past 134 months, FANG's price/earnings ratio has gone down 83.3.

Below are key valuation metrics over time for FANG.

Stock Date P/S P/B P/E EV/EBIT
FANG 2023-11-10 3.4 1.7 8.8 7.9
FANG 2023-11-09 3.4 1.7 8.7 7.9
FANG 2023-11-08 3.4 1.7 8.8 7.9
FANG 2023-11-07 3.4 1.8 8.2 7.7
FANG 2023-11-06 3.4 1.8 8.3 7.8
FANG 2023-11-03 3.5 1.9 8.4 7.9

FANG Growth Metrics

    The year over year net cashflow from operations growth rate now stands at 141.52%.
  • The 3 year revenue growth rate now stands at 213.31%.
  • The 5 year price growth rate now stands at -55.8%.
FANG's revenue has moved up $7,699,309,000 over the prior 52 months.

The table below shows FANG's growth in key financial areas (numbers in millions of US dollars).

Date Revenue Operating Cash Flow Net Income to Common Stock
2022-12-31 9,643 6,325 4,386
2022-09-30 9,635 6,051 4,381
2022-06-30 9,108 5,325 3,846
2022-03-31 8,021 4,572 2,741
2021-12-31 6,797 3,944 2,182
2021-09-30 5,544 3,180 441

FANG's Quality Factors

The “Quality” component of the POWR Ratings focuses on 31 different factors of a companies fundamentals and operational strength. Here are some key insights as we drill into the specifics of these quality attributes.
  • FANG has a Quality Grade of B, ranking ahead of 87.72% of graded US stocks.
  • FANG's asset turnover comes in at 0.216 -- ranking 104th of 137 Petroleum and Natural Gas stocks.
  • MTDR, LPI, and AXAS are the stocks whose asset turnover ratios are most correlated with FANG.

The table below shows FANG's key quality metrics over time.

Period Asset Turnover Gross Margin ROIC
2021-06-30 0.216 0.772 -0.057
2021-03-31 0.157 0.728 -0.199
2020-12-31 0.140 0.692 -0.219
2020-09-30 0.146 0.706 -0.196
2020-06-30 0.150 0.721 -0.120
2020-03-31 0.171 0.755 0.011

FANG Price Target

For more insight on analysts targets of FANG, see our FANG price target page. And for a list of of all stocks sorted by upside potential based on analyst target price, see our Top Price Target page.

Average Price Target $112.91 Average Broker Recommendation 1.41 (Moderate Buy)

Diamondback Energy Inc. (FANG) Company Bio


Diamondback Energy is a company engaged in hydrocarbon exploration headquartered in Midland, Texas. (Source:Wikipedia)


FANG Latest News Stream


Event/Time News Detail
Loading, please wait...

FANG Latest Social Stream


Loading social stream, please wait...

View Full FANG Social Stream

Latest FANG News From Around the Web

Below are the latest news stories about DIAMONDBACK ENERGY INC that investors may wish to consider to help them evaluate FANG as an investment opportunity.

3 Energy Plays That Dividend Investors Shouldn't Ignore

DINO, XOM and FANG are three fundamentally and operationally strong energy companies that should enable you to live off dividends through sector volatility.

Yahoo | November 22, 2023

Should You Consider Adding Diamondback Energy (FANG) to Your Portfolio?

Diamond Hill Capital, an investment management company, released its “Large Cap Strategy” third-quarter 2023 investor letter. A copy of the same can be downloaded here. In the third quarter, the strategy performed roughly in line with the Russell 1000 Index. Early indications of consumer weakness among select merchants and a significant increase in interest rates impacted […]

Yahoo | November 21, 2023

3 High-Yield Dividend Stocks to Buy in November

The stock market is all over the place. Investors looking for a simple solution that also helps them rest easy at night may want to consider picking up shares of top high-yield dividend stocks. Companies like American Electric Power (NASDAQ: AEP), Diamondback Energy (NASDAQ: FANG), and Clorox (NYSE: CLX) pay you dividends no matter what the stock market is doing.

Yahoo | November 21, 2023

Diamondback (FANG) Q3 Earnings Beat Estimates on Higher Output

For 2023, Diamondback Energy (FANG) forecasts a capital spending budget between $2.66 billion and $2.7 billion and looks to pump around 447,000 BOE/d of hydrocarbon.

Yahoo | November 16, 2023

11 Cheap Hot Stocks To Buy Now

In this piece, we will take a look at the 11 cheap hot stocks to buy now. If you want to skip our overview of the stock market and recent developments, then take a look at 5 Cheap Hot Stocks To Buy Now. The stock market of today is significantly more complex than the market […]

Yahoo | November 13, 2023

Read More 'FANG' Stories Here

FANG Price Returns

1-mo -2.77%
3-mo N/A
6-mo 21.03%
1-year 11.93%
3-year 323.27%
5-year 76.20%
YTD 19.04%
2022 35.34%
2021 127.51%
2020 -46.00%
2019 0.92%
2018 -26.35%

FANG Dividends

Ex-Dividend Date Type Payout Amount Change
Loading, please wait...
View Full FANG Dividend History

Get Free Updates

Join thousands of investors who get the latest news, insights and top rated picks from StockNews.com!