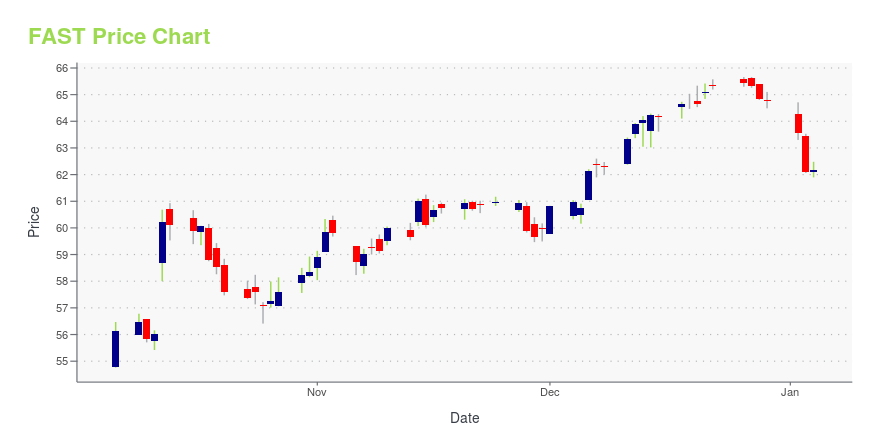
Fastenal Co. (FAST): Price and Financial Metrics

Fastenal Co. (FAST): $62.29

0.07 (-0.11%)

POWR Rating

Component Grades

Momentum

A

Stability

B

Sentiment

Quality

A

Add FAST to Watchlist
Sign Up

Industry: Industrial - Equipment

Industry

C

Ranked

#47 of 92

in industry

FAST Price/Volume Stats

Current price $62.29 52-week high $62.60
Prev. close $62.36 52-week low $45.70
Day low $62.00 Volume 3,136,700
Day high $62.47 Avg. volume 3,243,229
50-day MA $58.94 Dividend yield 2.3%
200-day MA $56.12 Market Cap 35.60B

FAST Stock Price Chart Interactive Chart >

FAST POWR Grades

  • FAST scores best on the Quality dimension, with a Quality rank ahead of 97.53% of US stocks.
  • FAST's strongest trending metric is Quality; it's been moving up over the last 177 days.
  • FAST's current lowest rank is in the Value metric (where it is better than 4.61% of US stocks).

FAST Stock Summary

  • FAST has a market capitalization of $34,753,348,695 -- more than approximately 92.82% of US stocks.
  • FAST's one year PEG ratio, measuring expected growth in earnings next year relative to current common stock price is 495.66 -- higher than 93.61% of US-listed equities with positive expected earnings growth.
  • In terms of volatility of its share price, FAST is more volatile than only 3.83% of stocks we're observing.
  • If you're looking for stocks that are quantitatively similar to FASTENAL CO, a group of peers worth examining would be HSY, PAYX, GWW, ULTA, and WIT.
  • FAST's SEC filings can be seen here. And to visit FASTENAL CO's official web site, go to www.fastenal.com.

FAST Valuation Summary

  • FAST's price/earnings ratio is 30.2; this is 45.19% higher than that of the median Industrials stock.
  • FAST's price/earnings ratio has moved down 14.7 over the prior 243 months.

Below are key valuation metrics over time for FAST.

Stock Date P/S P/B P/E EV/EBIT
FAST 2023-11-30 4.7 9.9 30.2 22.9
FAST 2023-11-29 4.7 9.8 30.0 22.7
FAST 2023-11-28 4.7 9.9 30.2 22.8
FAST 2023-11-27 4.8 10.0 30.7 23.2
FAST 2023-11-24 4.8 10.0 30.7 23.2
FAST 2023-11-22 4.8 10.0 30.7 23.2

FAST Growth Metrics

    The 3 year revenue growth rate now stands at 23.76%.
  • Its year over year cash and equivalents growth rate is now at -29.86%.
  • Its 5 year price growth rate is now at 56.9%.
FAST's revenue has moved up $1,589,200,000 over the prior 34 months.

The table below shows FAST's growth in key financial areas (numbers in millions of US dollars).

Date Revenue Operating Cash Flow Net Income to Common Stock
2022-12-31 6,980.6 941 1,086.9
2022-09-30 6,817 795.5 1,072.5
2022-06-30 6,568.8 705 1,031.4
2022-03-31 6,297.9 725.3 984
2021-12-31 6,010.9 770.1 925
2021-09-30 5,836.9 934.7 889.9

FAST's Quality Factors

The “Quality” component of the POWR Ratings focuses on 31 different factors of a companies fundamentals and operational strength. Here are some key insights as we drill into the specifics of these quality attributes.
  • FAST has a Quality Grade of A, ranking ahead of 96.11% of graded US stocks.
  • FAST's asset turnover comes in at 1.421 -- ranking 86th of 165 Retail stocks.
  • KR, BIG, and ZUMZ are the stocks whose asset turnover ratios are most correlated with FAST.

The table below shows FAST's key quality metrics over time.

Period Asset Turnover Gross Margin ROIC
2021-09-30 1.421 0.460 0.309
2021-06-30 1.397 0.457 0.304
2021-03-31 1.404 0.452 0.302
2020-12-31 1.404 0.455 0.297
2020-09-30 1.398 0.458 0.292
2020-06-30 1.415 0.462 0.291

FAST Price Target

For more insight on analysts targets of FAST, see our FAST price target page. And for a list of of all stocks sorted by upside potential based on analyst target price, see our Top Price Target page.

Average Price Target $53.33 Average Broker Recommendation 1.97 (Hold)

Fastenal Co. (FAST) Company Bio


Fastenal Company is an American company based in WinonaMinnesota. It ranked 479 in the 2021 Fortune 500 based on its 2020 revenues, and its stock is a component of the Nasdaq 100 and S&P 500 stock market indices. Fastenal's service model centers on approximately 3,200 in-market locations, each providing custom inventory and a dedicated sales team. (Source:Wikipedia)


FAST Latest News Stream


Event/Time News Detail
Loading, please wait...

FAST Latest Social Stream


Loading social stream, please wait...

View Full FAST Social Stream

Latest FAST News From Around the Web

Below are the latest news stories about FASTENAL CO that investors may wish to consider to help them evaluate FAST as an investment opportunity.

Fastenal (FAST) Rises Yet Lags Behind Market: Some Facts Worth Knowing

Fastenal (FAST) closed the most recent trading day at $62.36, moving +0.37% from the previous trading session.

Yahoo | December 7, 2023

Fastenal Co's Dividend Analysis

Fastenal Co (NASDAQ:FAST) recently announced a dividend of $0.38 per share, payable on 2023-12-20, with the ex-dividend date set for 2023-12-05. As investors look forward to this upcoming payment, the spotlight also shines on the company's dividend history, yield, and growth rates. Using the data from GuruFocus, let's delve into Fastenal Co's dividend performance and assess its sustainability.

Yahoo | December 4, 2023

A Bull Market Is Coming: 3 Stocks to Buy Without Any Hesitation

There are a lot of ways to do that, but here are three stocks that you should strongly consider: NextEra Energy (NYSE: NEE), Rockwell Automation (NYSE: ROK), and Fastenal (NASDAQ: FAST). Buying NextEra Energy is really like buying two companies in one. The foundation for the business is the company's regulated utility operation (about 70% of the company).

Yahoo | December 1, 2023

Fastenal (FAST) Surpasses Market Returns: Some Facts Worth Knowing

In the most recent trading session, Fastenal (FAST) closed at $59.97, indicating a +0.55% shift from the previous trading day.

Yahoo | November 30, 2023

Fastenal Company (NASDAQ:FAST) Will Pay A US$0.38 Dividend In Four Days

Fastenal Company ( NASDAQ:FAST ) is about to trade ex-dividend in the next 4 days. The ex-dividend date is one business...

Yahoo | November 30, 2023

Read More 'FAST' Stories Here

FAST Price Returns

1-mo 6.00%
3-mo 15.69%
6-mo 15.02%
1-year 26.19%
3-year 35.61%
5-year 160.70%
YTD 35.90%
2022 -24.34%
2021 34.06%
2020 36.60%
2019 44.63%
2018 -1.61%

FAST Dividends

Ex-Dividend Date Type Payout Amount Change
Loading, please wait...
View Full FAST Dividend History

Get Free Updates

Join thousands of investors who get the latest news, insights and top rated picks from StockNews.com!