Fortune Brands Home & Security Inc. (FBHS): Price and Financial Metrics


Fortune Brands Home & Security Inc. (FBHS): $61.90

-1.32 (-2.09%)

POWR Rating

Component Grades

Growth

S

Value

I

Momentum

G

Stability

N

Sentiment

U

Quality

P

FBHS POWR Grades

  • Quality is the dimension where FBHS ranks best; there it ranks ahead of 67.51% of US stocks.
  • The strongest trend for FBHS is in Growth, which has been heading down over the past 83 days.
  • FBHS's current lowest rank is in the Momentum metric (where it is better than 28.92% of US stocks).

FBHS Stock Summary

  • Revenue growth over the past 12 months for FORTUNE BRANDS INNOVATIONS INC comes in at -38.31%, a number that bests only 5.36% of the US stocks we're tracking.
  • The volatility of FORTUNE BRANDS INNOVATIONS INC's share price is greater than that of just 11.75% US stocks with at least 200 days of trading history.
  • FORTUNE BRANDS INNOVATIONS INC's shareholder yield -- a measure of how much capital is returned to stockholders via dividends and buybacks -- is 10.41%, greater than the shareholder yield of 83.4% of stocks in our set.
  • If you're looking for stocks that are quantitatively similar to FORTUNE BRANDS INNOVATIONS INC, a group of peers worth examining would be VHI, LIVE, BWA, SWK, and TCS.
  • Visit FBHS's SEC page to see the company's official filings. To visit the company's web site, go to www.fbhs.com.

FBHS Valuation Summary

  • FBHS's price/earnings ratio is 10.6; this is 16.54% lower than that of the median Consumer Cyclical stock.
  • FBHS's price/earnings ratio has moved down 23.9 over the prior 140 months.

Below are key valuation metrics over time for FBHS.

Stock Date P/S P/B P/E EV/EBIT
FBHS 2023-03-17 1.5 3.5 10.6 10.0
FBHS 2023-03-16 1.6 3.5 10.7 10.1
FBHS 2023-03-15 1.5 3.5 10.5 9.9
FBHS 2023-03-14 1.6 3.5 10.7 10.1
FBHS 2023-03-13 1.5 3.5 10.6 10.0
FBHS 2023-03-10 1.6 3.5 10.7 10.0

FBHS Growth Metrics

    Its 5 year cash and equivalents growth rate is now at 70.64%.
  • The year over year net cashflow from operations growth rate now stands at -25.38%.
  • The 2 year revenue growth rate now stands at 33.62%.
FBHS's revenue has moved up $2,280,100,000 over the prior 33 months.

The table below shows FBHS's growth in key financial areas (numbers in millions of US dollars).

Date Revenue Operating Cash Flow Net Income to Common Stock
2022-09-30 8,044.7 546.7 752.4
2022-06-30 7,977.3 467.9 750.3
2022-03-31 7,802.4 574.8 775.5
2021-12-31 7,656.1 688.7 772.4
2021-09-30 7,353.1 749.7 760.7
2021-06-30 7,018.9 827.9 723.2

FBHS's Quality Factors

The “Quality” component of the POWR Ratings focuses on 31 different factors of a companies fundamentals and operational strength. Here are some key insights as we drill into the specifics of these quality attributes.
  • FBHS has a Quality Grade of C, ranking ahead of 66.96% of graded US stocks.
  • FBHS's asset turnover comes in at 0.967 -- ranking 38th of 51 Construction stocks.
  • BLD, IESC, and CHCI are the stocks whose asset turnover ratios are most correlated with FBHS.

The table below shows FBHS's key quality metrics over time.

Period Asset Turnover Gross Margin ROIC
2021-09-30 0.967 0.362 0.224
2021-06-30 0.966 0.362 0.224
2021-03-31 0.933 0.358 0.204
2020-12-31 0.919 0.355 0.194
2020-09-30 0.928 0.354 0.188
2020-06-30 0.906 0.356 0.171

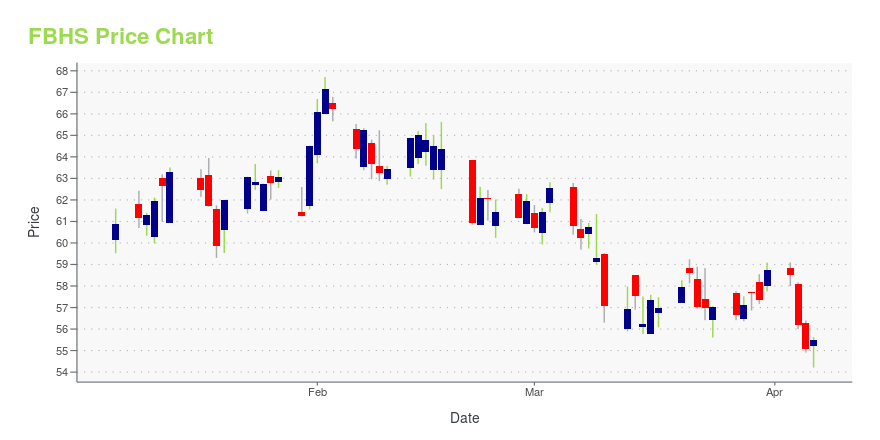
FBHS Stock Price Chart Interactive Chart >

Price chart for FBHS

FBHS Price/Volume Stats

Current price $61.90 52-week high $108.41
Prev. close $63.22 52-week low $52.95
Day low $61.17 Volume 2,258,400
Day high $64.02 Avg. volume 1,354,246
50-day MA $60.64 Dividend yield 1.81%
200-day MA $66.37 Market Cap 7.94B

Fortune Brands Home & Security Inc. (FBHS) Company Bio


Fortune Brands Home & Security, Inc. (or "Fortune Brands") is an American manufacturer of home and security products, headquartered in Deerfield, Illinois. Its portfolio of businesses and brands includes Moen and the House of Rohl; outdoor living and security products from Therma-Tru, Larson, Fiberon, Master Lock and SentrySafe; and MasterBrand Cabinets. Fortune Brands is a Fortune 500 company and part of the S&P 500 Index. As of December 31, 2021, the company reported employing approximately 28,000 associates and posted full-year 2021 net sales of $7.7 billion. (Source:Wikipedia)


FBHS Latest News Stream


Event/Time News Detail
Loading, please wait...

FBHS Latest Social Stream


Loading social stream, please wait...

View Full FBHS Social Stream

Latest FBHS News From Around the Web

Below are the latest news stories about FORTUNE BRANDS INNOVATIONS INC that investors may wish to consider to help them evaluate FBHS as an investment opportunity.

Dear First Solar (FSLR) Stock Fans, Mark Your Calendars for Dec. 19

First Solar (FSLR) stock is rising higher on Tuesday as investors prepare for a potential major catalyst coming on Dec.

William White on InvestorPlace | December 13, 2022

Analysts Conflicted on These Industrial Goods Names: Entegris (ENTG), Fortune Brands (FBHS) and Masco (MAS)

Analysts have been eager to weigh in on the Industrial Goods sector with new ratings on Entegris (ENTG – Research Report), Fortune Brands (FBHS – Research Report) and Masco (MAS – Research Report). Entegris (ENTG) In a report released today, Toshiya Hari from Goldman Sachs maintained a Buy rating on Entegris, with a price target of $104.00. The company's shares closed last Thursday at $79.91, close to its 52-week low of $70.98. According to TipRanks.

Catie Powers on TipRanks | October 27, 2022

Read More 'FBHS' Stories Here

FBHS Price Returns

1-mo N/A
3-mo N/A
6-mo 11.79%
1-year -21.18%
3-year 84.22%
5-year 14.48%
YTD N/A
2022 0.00%
2021 26.02%
2020 32.92%
2019 74.91%
2018 -43.66%

FBHS Dividends

Ex-Dividend Date Type Payout Amount Change
Loading, please wait...
View Full FBHS Dividend History

Get Free Updates

Join thousands of investors who get the latest news, insights and top rated picks from StockNews.com!


Page generated in 0.8877 seconds.