The First Bancshares, Inc. (FBMS): Price and Financial Metrics

The First Bancshares, Inc. (FBMS): $27.50

0.37 (+1.36%)

POWR Rating

Component Grades

Momentum

C

Stability

C

Sentiment

Quality

D

Add FBMS to Watchlist
Sign Up

Industry: Southeast Regional Banks

Industry

F

Ranked

#7 of 26

in industry

FBMS Price/Volume Stats

Current price $27.50 52-week high $34.05
Prev. close $27.13 52-week low $22.82
Day low $27.30 Volume 115,715
Day high $27.83 Avg. volume 119,597
50-day MA $26.16 Dividend yield 3.57%
200-day MA $26.95 Market Cap 854.98M

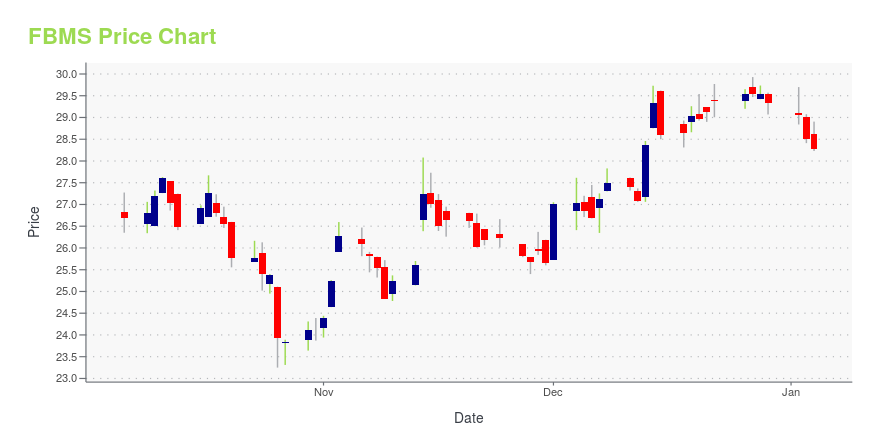
FBMS Stock Price Chart Interactive Chart >

FBMS POWR Grades

  • Stability is the dimension where FBMS ranks best; there it ranks ahead of 65.11% of US stocks.
  • FBMS's strongest trending metric is Value; it's been moving up over the last 177 days.
  • FBMS's current lowest rank is in the Quality metric (where it is better than 22.11% of US stocks).

FBMS Stock Summary

  • FBMS's equity multiplier -- a measure of assets relative to shareholders'equity -- is greater than that of 87.91% of US stocks.
  • With a year-over-year growth in debt of 79.05%, FIRST BANCSHARES INC's debt growth rate surpasses 89.87% of about US stocks.
  • As for revenue growth, note that FBMS's revenue has grown 36.14% over the past 12 months; that beats the revenue growth of 86.91% of US companies in our set.
  • Stocks with similar financial metrics, market capitalization, and price volatility to FIRST BANCSHARES INC are FULT, WABC, HTBI, FBNC, and BFC.
  • Visit FBMS's SEC page to see the company's official filings. To visit the company's web site, go to www.thefirstbank.com.

FBMS Valuation Summary

  • In comparison to the median Financial Services stock, FBMS's EV/EBIT ratio is 9.82% lower, now standing at 10.1.
  • FBMS's EV/EBIT ratio has moved up 2.8 over the prior 203 months.

Below are key valuation metrics over time for FBMS.

Stock Date P/S P/B P/E EV/EBIT
FBMS 2023-11-28 2.9 0.9 9.9 10.1
FBMS 2023-11-27 2.9 0.9 9.9 10.2
FBMS 2023-11-24 2.9 0.9 10.1 10.3
FBMS 2023-11-22 2.9 0.9 10.1 10.3
FBMS 2023-11-21 2.9 0.9 10.0 10.2
FBMS 2023-11-20 3.0 0.9 10.3 10.4

FBMS Growth Metrics

    The year over year price growth rate now stands at -18.32%.
  • Its 2 year price growth rate is now at 74.19%.
  • The year over year revenue growth rate now stands at 6.53%.
Over the past 67 months, FBMS's revenue has gone up $147,826,275.

The table below shows FBMS's growth in key financial areas (numbers in millions of US dollars).

Date Revenue Operating Cash Flow Net Income to Common Stock
2022-09-30 204.284 87.236 62.416
2022-06-30 200.028 82.909 64.505
2022-03-31 196.735 86.612 64.352
2021-12-31 195.641 95.715 64.167
2021-09-30 192.059 91.873 63.71
2021-06-30 184.291 82.103 59.495

FBMS's Quality Factors

The “Quality” component of the POWR Ratings focuses on 31 different factors of a companies fundamentals and operational strength. Here are some key insights as we drill into the specifics of these quality attributes.
  • FBMS has a Quality Grade of C, ranking ahead of 38.4% of graded US stocks.
  • FBMS's asset turnover comes in at 0.035 -- ranking 280th of 428 Banking stocks.
  • PLBC, HONE, and RVSB are the stocks whose asset turnover ratios are most correlated with FBMS.

The table below shows FBMS's key quality metrics over time.

Period Asset Turnover Gross Margin ROIC
2021-06-30 0.035 1 0.016
2021-03-31 0.035 1 0.016
2020-12-31 0.035 1 0.014
2020-09-30 0.036 1 0.014
2020-06-30 0.038 1 0.015
2020-03-31 0.039 1 0.016

FBMS Price Target

For more insight on analysts targets of FBMS, see our FBMS price target page. And for a list of of all stocks sorted by upside potential based on analyst target price, see our Top Price Target page.

Average Price Target $43.20 Average Broker Recommendation 1.5 (Moderate Buy)

The First Bancshares, Inc. (FBMS) Company Bio


The First Bancshares, Inc. operates as the bank holding company for The First, A National Banking Association that provides commercial and retail banking services to small to medium-sized businesses, professional concerns, and individuals in Mississippi, Alabama, and Louisiana. The company was founded in 1995 and is based in Hattiesburg, Mississippi.


FBMS Latest News Stream


Event/Time News Detail
Loading, please wait...

FBMS Latest Social Stream


Loading social stream, please wait...

View Full FBMS Social Stream

Latest FBMS News From Around the Web

Below are the latest news stories about FIRST BANCSHARES INC that investors may wish to consider to help them evaluate FBMS as an investment opportunity.

First Bancshares' (NASDAQ:FBMS) Dividend Will Be Increased To $0.24

The First Bancshares, Inc. ( NASDAQ:FBMS ) has announced that it will be increasing its dividend from last year's...

Yahoo | October 29, 2023

The First Bancshares, Inc. (NASDAQ:FBMS) Q3 2023 Earnings Call Transcript

The First Bancshares, Inc. (NASDAQ:FBMS) Q3 2023 Earnings Call Transcript October 26, 2023 Hoppy Cole: [Call Starts Abruptly] I’ll give a few high level highlights of the quarter and then turn it over to other members of our teams in their respective areas. This morning I’ve got Dee Dee Lowery, our CFO with us; George […]

Yahoo | October 27, 2023

Q3 2023 First Bancshares Inc (Mississippi) Earnings Call

Q3 2023 First Bancshares Inc (Mississippi) Earnings Call

Yahoo | October 27, 2023

The First Bancshares (FBMS) Lags Q3 Earnings Estimates

The First Bancshares (FBMS) delivered earnings and revenue surprises of -5% and 4.89%, respectively, for the quarter ended September 2023. Do the numbers hold clues to what lies ahead for the stock?

Yahoo | October 25, 2023

The First Bancshares, Inc. Reports Results for Third Quarter ended September 30, 2023; Increases Quarterly Dividend 4%

HATTIESBURG, Miss., October 25, 2023--The First Bancshares, Inc. ("FBMS" or "the Company") (NASDAQ: FBMS), holding company for The First Bank, (www.thefirstbank.com) reported today financial results for the quarter ended September 30, 2023.

Yahoo | October 25, 2023

Read More 'FBMS' Stories Here

FBMS Price Returns

1-mo 7.72%
3-mo -1.79%
6-mo -1.04%
1-year -15.04%
3-year -0.42%
5-year -6.61%
YTD -11.28%
2022 -15.21%
2021 26.97%
2020 -11.48%
2019 18.56%
2018 -11.04%

FBMS Dividends

Ex-Dividend Date Type Payout Amount Change
Loading, please wait...
View Full FBMS Dividend History

Get Free Updates

Join thousands of investors who get the latest news, insights and top rated picks from StockNews.com!