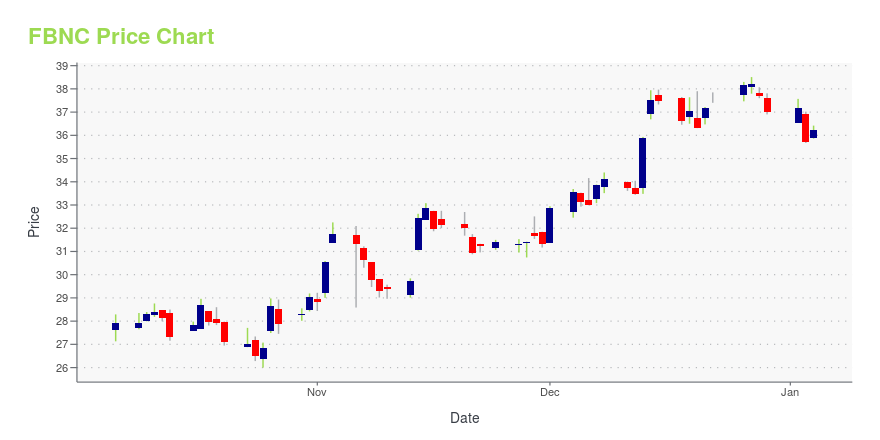
First Bancorp (FBNC): Price and Financial Metrics
GET POWR RATINGS... FREE!
FBNC POWR Grades
- Momentum is the dimension where FBNC ranks best; there it ranks ahead of 83.6% of US stocks.
- FBNC's strongest trending metric is Growth; it's been moving up over the last 177 days.
- FBNC ranks lowest in Quality; there it ranks in the 19th percentile.
FBNC Stock Summary
- FBNC's one year PEG ratio, measuring expected growth in earnings next year relative to current common stock price is 147.69 -- higher than 83.55% of US-listed equities with positive expected earnings growth.
- FBNC's equity multiplier -- a measure of assets relative to shareholders'equity -- is greater than that of 90.13% of US stocks.
- With a year-over-year growth in debt of 215.45%, FIRST BANCORP's debt growth rate surpasses 93.39% of about US stocks.
- Stocks with similar financial metrics, market capitalization, and price volatility to FIRST BANCORP are STBA, SYBT, MPB, FULT, and TRMK.
- FBNC's SEC filings can be seen here. And to visit FIRST BANCORP's official web site, go to www.localfirstbank.com.
FBNC Valuation Summary
- In comparison to the median Financial Services stock, FBNC's EV/EBIT ratio is 10.62% lower, now standing at 10.1.
- FBNC's price/sales ratio has moved up 0.3 over the prior 243 months.
Below are key valuation metrics over time for FBNC.
Stock | Date | P/S | P/B | P/E | EV/EBIT |
---|---|---|---|---|---|
FBNC | 2023-02-03 | 4.2 | 1.6 | 12.9 | 10.1 |
FBNC | 2023-02-02 | 4.2 | 1.5 | 12.7 | 9.9 |
FBNC | 2023-02-01 | 4.0 | 1.5 | 12.3 | 9.6 |
FBNC | 2023-01-31 | 3.9 | 1.4 | 12.0 | 9.4 |
FBNC | 2023-01-30 | 3.8 | 1.4 | 11.6 | 9.1 |
FBNC | 2023-01-27 | 3.8 | 1.4 | 11.5 | 9.0 |
FBNC Growth Metrics
- The 5 year net cashflow from operations growth rate now stands at 69.41%.
- Its 4 year net income to common stockholders growth rate is now at 212.85%.
- The year over year net cashflow from operations growth rate now stands at 180.98%.

The table below shows FBNC's growth in key financial areas (numbers in millions of US dollars).
Date | Revenue | Operating Cash Flow | Net Income to Common Stock |
---|---|---|---|
2022-09-30 | 361.968 | 206.934 | 119.025 |
2022-06-30 | 340.537 | 188.32 | 108.719 |
2022-03-31 | 323.197 | 208.311 | 101.419 |
2021-12-31 | 304.975 | 138.901 | 95.644 |
2021-09-30 | 301.487 | 134.206 | 108.77 |
2021-06-30 | 296.137 | 93.676 | 104.424 |
FBNC's Quality Factors
The “Quality” component of the POWR Ratings focuses on 31 different factors of a companies fundamentals and operational strength. Here are some key insights as we drill into the specifics of these quality attributes.- FBNC has a Quality Grade of C, ranking ahead of 30.19% of graded US stocks.
- FBNC's asset turnover comes in at 0.039 -- ranking 190th of 431 Banking stocks.
- EWBC, BANR, and HTLF are the stocks whose asset turnover ratios are most correlated with FBNC.
The table below shows FBNC's key quality metrics over time.
Period | Asset Turnover | Gross Margin | ROIC |
---|---|---|---|
2021-06-30 | 0.039 | 1 | 0.019 |
2021-03-31 | 0.038 | 1 | 0.018 |
2020-12-31 | 0.038 | 1 | 0.016 |
2020-09-30 | 0.039 | 1 | 0.016 |
2020-06-30 | 0.040 | 1 | 0.017 |
2020-03-31 | 0.044 | 1 | 0.019 |
FBNC Price Target
For more insight on analysts targets of FBNC, see our FBNC price target page. And for a list of of all stocks sorted by upside potential based on analyst target price, see our Top Price Target page.
Average Price Target | $50.10 | Average Broker Recommendation | 1.71 (Moderate Buy) |
FBNC Stock Price Chart Interactive Chart >
FBNC Price/Volume Stats
Current price | $42.45 | 52-week high | $49.00 |
Prev. close | $42.97 | 52-week low | $32.90 |
Day low | $42.04 | Volume | 153,700 |
Day high | $43.15 | Avg. volume | 164,438 |
50-day MA | $43.04 | Dividend yield | 2.05% |
200-day MA | $39.44 | Market Cap | 1.52B |
First Bancorp (FBNC) Company Bio
First Bancorp provides various banking products and services for individuals and small to medium-sized businesses primarily in North Carolina, southwestern Virginia, and northeastern South Carolina. The company was founded in 1934 and is based in Southern Pines, North Carolina.
Latest FBNC News From Around the Web
Below are the latest news stories about FIRST BANCORP that investors may wish to consider to help them evaluate FBNC as an investment opportunity.
First Bancorp. Announces Earnings for the Quarter and Year Ended December 31, 2022SAN JUAN, Puerto Rico--(BUSINESS WIRE)--First BanCorp. (the “Corporation” or “First BanCorp.”) (NYSE: FBP), the bank holding company for FirstBank Puerto Rico (“FirstBank” or “the Bank”), today reported net income of $73.2 million, or $0.40 per diluted share, for the fourth quarter of 2022, compared to $74.6 million, or $0.40 per diluted share, for the third quarter of 2022, and $73.6 million, or $0.35 per diluted share, for the fourth quarter of 2021. For the year ended December 31, 2022, the |
First BanCorp. (FBP) Q4 2022 Earnings Call TranscriptFirst BanCorp. (NYSE:NYSE:FBP) Q4 2022 Earnings Conference Call January 27, 2023 10:00 AM ETCompany ParticipantsRamon Rodriguez - Corporate Strategy and IR Officer Aurelio Aleman -… |
First BanCorp. Non-GAAP EPS of $0.40 in-line, revenue of $235.17M misses by $6MFirst BanCorp. press release (FBP): Q4 Non-GAAP EPS of $0.40 in-line.Revenue of $235.17M (+9.6% Y/Y) misses by $6M. |
Earnings Preview For First BanCorpFirst BanCorp (NYSE: FBP ) is set to give its latest quarterly earnings report on Friday, 2023-01-27. Here''s what investors need to know before the announcement. Analysts estimate that First BanCorp will report an earnings per share (EPS) of $0.40. First BanCorp bulls will hope to hear the company announce they''ve not only beaten that estimate, but also to provide positive guidance, or forecasted growth, for the … Full story available on Benzinga.com |
First BanCorp. Q4 2022 Earnings PreviewFirst BanCorp. (FBP) is scheduled to announce Q4 earnings results on Friday, January 27th, before market open.The consensus EPS Estimate is $0.40 (+11.1% Y/Y) and the consensus… |
FBNC Price Returns
1-mo | 2.39% |
3-mo | -6.47% |
6-mo | 14.81% |
1-year | -2.78% |
3-year | 23.30% |
5-year | 36.17% |
YTD | -0.91% |
2022 | -4.19% |
2021 | 37.67% |
2020 | -12.61% |
2019 | 24.00% |
2018 | -6.49% |
FBNC Dividends
Ex-Dividend Date | Type | Payout Amount | Change | ||||||
---|---|---|---|---|---|---|---|---|---|
Loading, please wait... |
Continue Researching FBNC
Want to see what other sources are saying about First Bancorp's financials and stock price? Try the links below:First Bancorp (FBNC) Stock Price | Nasdaq
First Bancorp (FBNC) Stock Quote, History and News - Yahoo Finance
First Bancorp (FBNC) Stock Price and Basic Information | MarketWatch
Loading social stream, please wait...