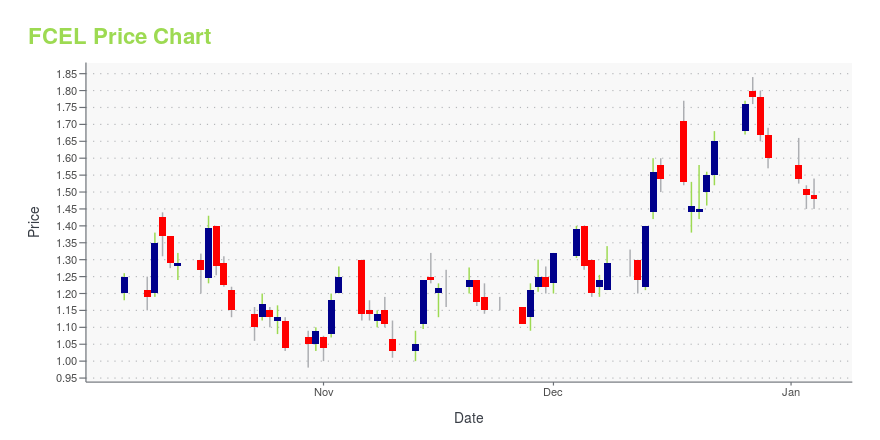
FuelCell Energy, Inc. (FCEL): Price and Financial Metrics
FCEL Price/Volume Stats
Current price | $1.26 | 52-week high | $4.36 |
Prev. close | $1.25 | 52-week low | $1.13 |
Day low | $1.25 | Volume | 1,694,213 |
Day high | $1.31 | Avg. volume | 12,052,179 |
50-day MA | $1.61 | Dividend yield | N/A |
200-day MA | $2.46 | Market Cap | 512.27M |
FCEL Stock Price Chart Interactive Chart >
FCEL POWR Grades
- FCEL scores best on the Growth dimension, with a Growth rank ahead of 38.41% of US stocks.
- FCEL's strongest trending metric is Growth; it's been moving down over the last 177 days.
- FCEL ranks lowest in Quality; there it ranks in the 0th percentile.
FCEL Stock Summary
- As for revenue growth, note that FCEL's revenue has grown 33.18% over the past 12 months; that beats the revenue growth of 83.21% of US companies in our set.
- The volatility of FUELCELL ENERGY INC's share price is greater than that of 84.72% US stocks with at least 200 days of trading history.
- Shareholder yield, a measure of how much is returned to shareholders via dividends and share repurchases, for FCEL comes in at -29.55% -- higher than that of just 15.09% of stocks in our set.
- Stocks with similar financial metrics, market capitalization, and price volatility to FUELCELL ENERGY INC are KPTI, TVTX, WATT, GH, and ASXC.
- FCEL's SEC filings can be seen here. And to visit FUELCELL ENERGY INC's official web site, go to www.fuelcellenergy.com.
FCEL Valuation Summary
- In comparison to the median Industrials stock, FCEL's price/earnings ratio is 123.66% lower, now standing at -4.4.
- FCEL's price/sales ratio has moved down 7.6 over the prior 243 months.
Below are key valuation metrics over time for FCEL.
Stock | Date | P/S | P/B | P/E | EV/EBIT |
---|---|---|---|---|---|
FCEL | 2023-09-19 | 3.9 | 0.8 | -4.4 | -3.2 |
FCEL | 2023-09-18 | 3.8 | 0.8 | -4.3 | -3.1 |
FCEL | 2023-09-15 | 4.0 | 0.8 | -4.5 | -3.4 |
FCEL | 2023-09-14 | 4.1 | 0.8 | -4.7 | -3.5 |
FCEL | 2023-09-13 | 4.1 | 0.8 | -4.7 | -3.5 |
FCEL | 2023-09-12 | 4.3 | 0.9 | -5.0 | -3.8 |
FCEL Growth Metrics
- Its 4 year net income to common stockholders growth rate is now at -87.02%.
- Its 3 year net income to common stockholders growth rate is now at -20.51%.
- Its 5 year net income to common stockholders growth rate is now at -87.02%.

The table below shows FCEL's growth in key financial areas (numbers in millions of US dollars).
Date | Revenue | Operating Cash Flow | Net Income to Common Stock |
---|---|---|---|
2022-09-30 | 130.484 | -112.167 | -145.922 |
2022-06-30 | 105.218 | -97.941 | -127.636 |
2022-03-31 | 88.934 | -93.983 | -110.219 |
2021-12-31 | 86.503 | -87.875 | -98.919 |
2021-09-30 | 69.585 | -70.438 | -104.255 |
2021-06-30 | 72.649 | -72.789 | -98.93 |
FCEL's Quality Factors
The “Quality” component of the POWR Ratings focuses on 31 different factors of a companies fundamentals and operational strength. Here are some key insights as we drill into the specifics of these quality attributes.- FCEL has a Quality Grade of F, ranking ahead of 1.3% of graded US stocks.
- FCEL's asset turnover comes in at 0.117 -- ranking 39th of 53 Electrical Equipment stocks.
- BLDP, SCWO, and SPB are the stocks whose asset turnover ratios are most correlated with FCEL.
The table below shows FCEL's key quality metrics over time.
Period | Asset Turnover | Gross Margin | ROIC |
---|---|---|---|
2021-07-31 | 0.117 | -0.211 | -0.205 |
2021-04-30 | 0.126 | -0.303 | -0.201 |
2021-01-31 | 0.146 | -0.210 | -0.177 |
2020-10-31 | 0.162 | -0.109 | -0.157 |
2020-07-31 | 0.167 | -0.355 | -0.205 |
2020-04-30 | 0.186 | -0.174 | -0.204 |
FCEL Price Target
For more insight on analysts targets of FCEL, see our FCEL price target page. And for a list of of all stocks sorted by upside potential based on analyst target price, see our Top Price Target page.
Average Price Target | $8.89 | Average Broker Recommendation | 2.15 (Hold) |
FuelCell Energy, Inc. (FCEL) Company Bio
FuelCell Energy, Inc. manufactures, sells, installs, operates, and services stationary fuel cell power plants for distributed power generation. The company was founded in 1969 and is based in Danbury, Connecticut.
Latest FCEL News From Around the Web
Below are the latest news stories about FUELCELL ENERGY INC that investors may wish to consider to help them evaluate FCEL as an investment opportunity.
34 Fuel Exporting Countries in the WorldIn this article, we will be studying the global fuel industry. We will also be looking at the current market conditions and some of the big players in this industry while covering the major fuel exporting countries in the world. If you wish to skip our detailed analysis, you can move directly to the 5 […] |
Beware! 3 Hydrogen Stocks Waving Massive Red Flags Right Now.Investors should consider unloading these hydrogen stocks to sell. |
Caution! 7 Penny Stocks That Have Much Further to FallBottom-fishers should take heed about these seven penny stocks to sell. |
FuelCell (FCEL) Q3 Loss Narrower Than Expected, Sales FallFuelCell Energy's (FCEL) fiscal Q3 sales beat estimates. The company benefits from expanding business operations and higher acceptance of FuelCell Power platforms. |
FuelCell Energy, Inc. (NASDAQ:FCEL) Q3 2023 Earnings Call TranscriptFuelCell Energy, Inc. (NASDAQ:FCEL) Q3 2023 Earnings Call Transcript September 11, 2023 FuelCell Energy, Inc. beats earnings expectations. Reported EPS is $0.06, expectations were $-0.08. Operator: Good morning. My name is Rob, and I will be your conference operator today. At this time, I would like to welcome everyone to FuelCell Energy Third Quarter 2023 […] |
FCEL Price Returns
1-mo | -11.27% |
3-mo | -41.67% |
6-mo | -55.79% |
1-year | -62.83% |
3-year | -50.78% |
5-year | -90.19% |
YTD | -54.68% |
2022 | -46.54% |
2021 | -53.45% |
2020 | 345.02% |
2019 | -61.97% |
2018 | -67.65% |
Continue Researching FCEL
Here are a few links from around the web to help you further your research on Fuelcell Energy Inc's stock as an investment opportunity:Fuelcell Energy Inc (FCEL) Stock Price | Nasdaq
Fuelcell Energy Inc (FCEL) Stock Quote, History and News - Yahoo Finance
Fuelcell Energy Inc (FCEL) Stock Price and Basic Information | MarketWatch
Loading social stream, please wait...