
Fidelity D & D Bancorp, Inc. (FDBC): Price and Financial Metrics
FDBC Price/Volume Stats
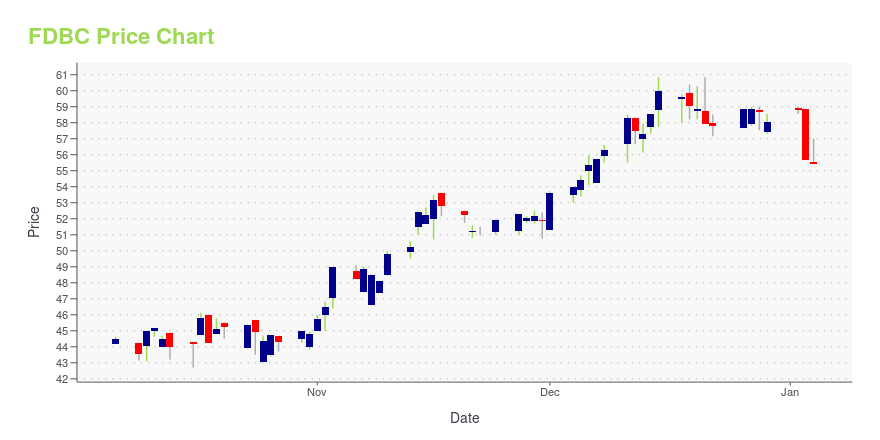
| Current price | $55.51 | 52-week high | $60.85 |
| Prev. close | $55.36 | 52-week low | $41.10 |
| Day low | $54.43 | Volume | 6,682 |
| Day high | $55.73 | Avg. volume | 6,905 |
| 50-day MA | $46.92 | Dividend yield | 2.73% |
| 200-day MA | $48.81 | Market Cap | 318.41M |
FDBC Stock Price Chart Interactive Chart >
Fidelity D & D Bancorp, Inc. (FDBC) Company Bio
Fidelity D & D Bancorp, Inc. operates as the holding company for The Fidelity Deposit and Discount Bank that provides a range of banking, financial, and trust services to individuals, small businesses, and corporate customers primarily in Lackawanna and Luzerne counties, Pennsylvania. The company accepts various deposits products, such as demand, savings, clubs, interest and non-interest bearing checking, money market, and interest-bearing time and savings accounts, as well as short-and long-term time deposits or certificates of deposit. Its loan portfolio includes commercial and industrial loans, commercial real estate loans, consumer loans, and residential mortgage loans. The company also provides alternative financial and insurance products with asset management services. As of December 31, 2019, it operated 12 full-service banking offices. Fidelity D & D Bancorp, Inc. was founded in 1902 and is headquartered in Dunmore, Pennsylvania.
Latest FDBC News From Around the Web
Below are the latest news stories about FIDELITY D & D BANCORP INC that investors may wish to consider to help them evaluate FDBC as an investment opportunity.
Should You Buy Fidelity D & D Bancorp, Inc. (NASDAQ:FDBC) For Its Upcoming Dividend?It looks like Fidelity D & D Bancorp, Inc. ( NASDAQ:FDBC ) is about to go ex-dividend in the next 4 days. The... |
Fidelity D & D Bancorp Inc (FDBC) Reports Q3 2023 Financial ResultsA detailed look at Fidelity D & D Bancorp Inc's third quarter financial performance |
Fidelity D & D Bancorp, Inc. Reports Third Quarter 2023 Financial ResultsDUNMORE, Pa., Oct. 25, 2023 (GLOBE NEWSWIRE) -- Fidelity D & D Bancorp, Inc. (NASDAQ: FDBC) and its banking subsidiary, The Fidelity Deposit and Discount Bank, announced its unaudited, consolidated financial results for the three and nine-month periods ended September 30, 2023. Unaudited Financial Information Net income for the quarter ended September 30, 2023 was $5.3 million, or $0.93 diluted earnings per share, compared to $7.6 million, or $1.36 diluted earnings per share, for the quarter end |
Fidelity D & D Bancorp's (NASDAQ:FDBC) Upcoming Dividend Will Be Larger Than Last Year'sFidelity D & D Bancorp, Inc. ( NASDAQ:FDBC ) has announced that it will be increasing its periodic dividend on the 8th... |
Fidelity D & D Bancorp, Inc. Announces Nineth Consecutive Year Increase with 6% Increase of Fourth Quarter 2023 DividendDUNMORE, Pa., Oct. 19, 2023 (GLOBE NEWSWIRE) -- The Board of Directors of Fidelity D & D Bancorp, Inc. (NASDAQ: FDBC), parent company of The Fidelity Deposit and Discount Bank, announce their declaration of the Company’s fourth quarter dividend of $0.38 per share, a 6% increase above the prior quarterly cash dividend of $0.36 per share. “On behalf of the Board of Directors and all Fidelity Bankers, I am proud to announce a dividend increase for the ninth consecutive year. We remain committed to |
FDBC Price Returns
| 1-mo | 31.70% |
| 3-mo | 21.88% |
| 6-mo | 11.06% |
| 1-year | 15.12% |
| 3-year | 17.79% |
| 5-year | -2.84% |
| YTD | -2.78% |
| 2023 | 26.91% |
| 2022 | -17.54% |
| 2021 | -6.19% |
| 2020 | 5.93% |
| 2019 | -1.38% |
FDBC Dividends
| Ex-Dividend Date | Type | Payout Amount | Change | ||||||
|---|---|---|---|---|---|---|---|---|---|
| Loading, please wait... | |||||||||
Continue Researching FDBC
Want to do more research on Fidelity D & D Bancorp Inc's stock and its price? Try the links below:Fidelity D & D Bancorp Inc (FDBC) Stock Price | Nasdaq
Fidelity D & D Bancorp Inc (FDBC) Stock Quote, History and News - Yahoo Finance
Fidelity D & D Bancorp Inc (FDBC) Stock Price and Basic Information | MarketWatch
Loading social stream, please wait...