Fidus Investment Corporation (FDUS): Price and Financial Metrics

Fidus Investment Corporation (FDUS): $19.19

0.27 (+1.43%)

POWR Rating

Component Grades

Momentum

B

Stability

C

Sentiment

Quality

C

Add FDUS to Watchlist
Sign Up

Industry: Private Equity

Industry

D

Ranked

#20 of 34

in industry

FDUS Price/Volume Stats

Current price $19.19 52-week high $21.25
Prev. close $18.92 52-week low $16.70
Day low $18.93 Volume 178,900
Day high $19.27 Avg. volume 130,562
50-day MA $19.63 Dividend yield 8.6%
200-day MA $19.50 Market Cap 485.81M

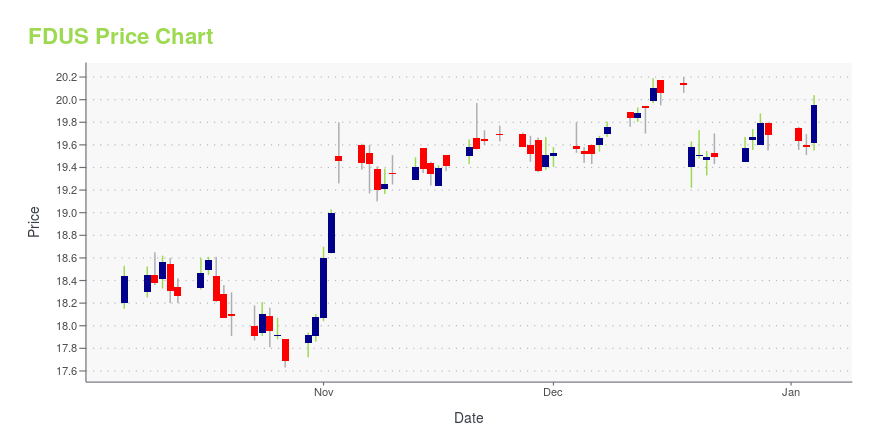
FDUS Stock Price Chart Interactive Chart >

FDUS POWR Grades

  • FDUS scores best on the Momentum dimension, with a Momentum rank ahead of 85.32% of US stocks.
  • The strongest trend for FDUS is in Quality, which has been heading down over the past 177 days.
  • FDUS ranks lowest in Quality; there it ranks in the 27th percentile.

FDUS Stock Summary

  • Of note is the ratio of FIDUS INVESTMENT CORP's sales and general administrative expense to its total operating expenses; 86.82% of US stocks have a lower such ratio.
  • For FDUS, its debt to operating expenses ratio is greater than that reported by 98.9% of US equities we're observing.
  • In terms of volatility of its share price, FDUS is more volatile than merely 1.77% of stocks we're observing.
  • If you're looking for stocks that are quantitatively similar to FIDUS INVESTMENT CORP, a group of peers worth examining would be OFS, SAR, ASR, PSEC, and GAIN.
  • FDUS's SEC filings can be seen here. And to visit FIDUS INVESTMENT CORP's official web site, go to www.fdus.com.

FDUS Valuation Summary

  • In comparison to the median Financial Services stock, FDUS's price/sales ratio is 91.3% higher, now standing at 4.4.
  • Over the past 149 months, FDUS's EV/EBIT ratio has gone up 7.

Below are key valuation metrics over time for FDUS.

Stock Date P/S P/B P/E EV/EBIT
FDUS 2023-09-15 4.4 1 11.6 14.4
FDUS 2023-09-14 4.4 1 11.6 14.3
FDUS 2023-09-13 4.4 1 11.5 14.3
FDUS 2023-09-12 4.4 1 11.6 14.3
FDUS 2023-09-11 4.4 1 11.6 14.3
FDUS 2023-09-08 4.3 1 11.4 14.2

FDUS Growth Metrics

    Its year over year net income to common stockholders growth rate is now at 66.71%.
  • Its 2 year price growth rate is now at 119.27%.
  • The 2 year net income to common stockholders growth rate now stands at 1048.43%.
FDUS's revenue has moved up $28,998,000 over the prior 67 months.

The table below shows FDUS's growth in key financial areas (numbers in millions of US dollars).

Date Revenue Operating Cash Flow Net Income to Common Stock
2022-09-30 90.764 -48.322 81.337
2022-06-30 87.001 30.844 98.351
2022-03-31 87.674 33.753 116.256
2021-12-31 90.446 167.901 116.104
2021-09-30 89.975 107.705 95.383
2021-06-30 89.823 95.025 87.648

FDUS's Quality Factors

The “Quality” component of the POWR Ratings focuses on 31 different factors of a companies fundamentals and operational strength. Here are some key insights as we drill into the specifics of these quality attributes.
  • FDUS has a Quality Grade of C, ranking ahead of 63.36% of graded US stocks.
  • FDUS's asset turnover comes in at 0.112 -- ranking 182nd of 444 Trading stocks.
  • RC, CBOE, and SQFT are the stocks whose asset turnover ratios are most correlated with FDUS.

The table below shows FDUS's key quality metrics over time.

Period Asset Turnover Gross Margin ROIC
2021-06-30 0.112 0.616 0.097
2021-03-31 0.112 0.667 0.081
2020-12-31 0.109 0.768 0.046
2020-09-30 0.106 0.790 0.038
2020-06-30 0.103 0.807 0.031
2020-03-31 0.102 0.822 0.027

FDUS Price Target

For more insight on analysts targets of FDUS, see our FDUS price target page. And for a list of of all stocks sorted by upside potential based on analyst target price, see our Top Price Target page.

Average Price Target $18.64 Average Broker Recommendation 1.33 (Strong Buy)

Fidus Investment Corporation (FDUS) Company Bio


Fidus Investment Corp provides customized debt and equity financing solutions to lower middle market companies. The company was founded in 2007 and is based in Evanston, IL.


FDUS Latest News Stream


Event/Time News Detail
Loading, please wait...

FDUS Latest Social Stream


Loading social stream, please wait...

View Full FDUS Social Stream

Latest FDUS News From Around the Web

Below are the latest news stories about FIDUS INVESTMENT CORP that investors may wish to consider to help them evaluate FDUS as an investment opportunity.

Unveiling Fidus Investment Corp's Dividend Performance: A Comprehensive Analysis

As investors look forward to this upcoming payment, the spotlight also shines on the company's dividend history, yield, and growth rates. Using the data from GuruFocus, let's deep dive into Fidus Investment Corps dividend performance and assess its sustainability. Fidus Investment Corp is an externally managed, closed-end, non-diversified management investment company that has elected to be treated as a business development company.

Yahoo | September 19, 2023

After Plunging -8.74% in 4 Weeks, Here's Why the Trend Might Reverse for Fidus Investment (FDUS)

Fidus Investment (FDUS) is technically in oversold territory now, so the heavy selling pressure might have exhausted. This along with strong agreement among Wall Street analysts in raising earnings estimates could lead to a trend reversal for the stock.

Yahoo | September 1, 2023

All You Need to Know About Fidus Investment (FDUS) Rating Upgrade to Strong Buy

Fidus Investment (FDUS) has been upgraded to a Zacks Rank #1 (Strong Buy), reflecting growing optimism about the company's earnings prospects. This might drive the stock higher in the near term.

Yahoo | August 29, 2023

Q2 2023 Fidus Investment Corp Earnings Call

Q2 2023 Fidus Investment Corp Earnings Call

Yahoo | August 5, 2023

Fidus Investment (FDUS) Q2 Earnings and Revenues Beat Estimates

Fidus Investment (FDUS) delivered earnings and revenue surprises of 6.90% and 5.39%, respectively, for the quarter ended June 2023. Do the numbers hold clues to what lies ahead for the stock?

Yahoo | August 3, 2023

Read More 'FDUS' Stories Here

FDUS Price Returns

1-mo 3.14%
3-mo 1.67%
6-mo 8.29%
1-year 27.24%
3-year 163.57%
5-year 128.14%
YTD 12.32%
2022 17.09%
2021 50.66%
2020 -0.78%
2019 40.72%
2018 -13.70%

FDUS Dividends

Ex-Dividend Date Type Payout Amount Change
Loading, please wait...
View Full FDUS Dividend History

Continue Researching FDUS

Here are a few links from around the web to help you further your research on FIDUS INVESTMENT Corp's stock as an investment opportunity:

FIDUS INVESTMENT Corp (FDUS) Stock Price | Nasdaq
FIDUS INVESTMENT Corp (FDUS) Stock Quote, History and News - Yahoo Finance
FIDUS INVESTMENT Corp (FDUS) Stock Price and Basic Information | MarketWatch

Get Free Updates

Join thousands of investors who get the latest news, insights and top rated picks from StockNews.com!