Franklin Electric Co., Inc. (FELE): Price and Financial Metrics
FELE Price/Volume Stats
Current price | $90.17 | 52-week high | $107.36 |
Prev. close | $89.63 | 52-week low | $77.58 |
Day low | $89.70 | Volume | 132,700 |
Day high | $91.13 | Avg. volume | 164,126 |
50-day MA | $96.50 | Dividend yield | 0.98% |
200-day MA | $92.50 | Market Cap | 4.17B |
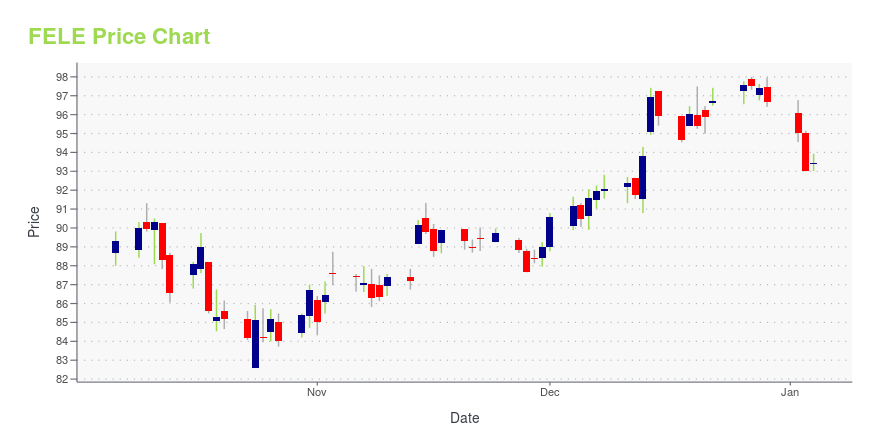
FELE Stock Price Chart Interactive Chart >
FELE POWR Grades
- FELE scores best on the Momentum dimension, with a Momentum rank ahead of 85.35% of US stocks.
- The strongest trend for FELE is in Growth, which has been heading down over the past 179 days.
- FELE's current lowest rank is in the Growth metric (where it is better than 42.01% of US stocks).
FELE Stock Summary
- With a one year PEG ratio of 179.92, FRANKLIN ELECTRIC CO INC is expected to have a higher PEG ratio (a measure of how expensive a stock is relative to its expected earnings growth) than 84.61% of US stocks.
- FRANKLIN ELECTRIC CO INC's stock had its IPO on March 26, 1990, making it an older stock than 85.21% of US equities in our set.
- Of note is the ratio of FRANKLIN ELECTRIC CO INC's sales and general administrative expense to its total operating expenses; 85.91% of US stocks have a lower such ratio.
- Stocks that are quantitatively similar to FELE, based on their financial statements, market capitalization, and price volatility, are PSO, FIX, PSMT, CNXC, and VPG.
- Visit FELE's SEC page to see the company's official filings. To visit the company's web site, go to www.franklin-electric.com.
FELE Valuation Summary
- In comparison to the median Industrials stock, FELE's price/sales ratio is 66.67% higher, now standing at 2.
- FELE's EV/EBIT ratio has moved up 5 over the prior 243 months.
Below are key valuation metrics over time for FELE.
Stock | Date | P/S | P/B | P/E | EV/EBIT |
---|---|---|---|---|---|
FELE | 2023-09-15 | 2 | 3.7 | 21.9 | 17.6 |
FELE | 2023-09-14 | 2 | 3.7 | 22.0 | 17.7 |
FELE | 2023-09-13 | 2 | 3.7 | 21.7 | 17.4 |
FELE | 2023-09-12 | 2 | 3.7 | 21.7 | 17.5 |
FELE | 2023-09-11 | 2 | 3.7 | 21.9 | 17.6 |
FELE | 2023-09-08 | 2 | 3.7 | 22.0 | 17.7 |
FELE Growth Metrics
- The 3 year revenue growth rate now stands at 37.66%.
- Its 2 year price growth rate is now at 47.17%.
- Its 5 year price growth rate is now at 23.29%.

The table below shows FELE's growth in key financial areas (numbers in millions of US dollars).
Date | Revenue | Operating Cash Flow | Net Income to Common Stock |
---|---|---|---|
2022-12-31 | 2,043.711 | 101.674 | 187.332 |
2022-09-30 | 1,986.8 | 43.021 | 188.42 |
2022-06-30 | 1,894.147 | 31.692 | 175.968 |
2022-03-31 | 1,780.289 | 63.07 | 155.745 |
2021-12-31 | 1,661.865 | 129.763 | 153.86 |
2021-09-30 | 1,550.451 | 172.048 | 139.987 |
FELE's Quality Factors
The “Quality” component of the POWR Ratings focuses on 31 different factors of a companies fundamentals and operational strength. Here are some key insights as we drill into the specifics of these quality attributes.- FELE has a Quality Grade of B, ranking ahead of 80.84% of graded US stocks.
- FELE's asset turnover comes in at 1.105 -- ranking 7th of 53 Electrical Equipment stocks.
- BLNK, SCWO, and BLDP are the stocks whose asset turnover ratios are most correlated with FELE.
The table below shows FELE's key quality metrics over time.
Period | Asset Turnover | Gross Margin | ROIC |
---|---|---|---|
2021-09-30 | 1.105 | 0.350 | 0.246 |
2021-06-30 | 1.096 | 0.349 | 0.239 |
2021-03-31 | 1.071 | 0.349 | 0.219 |
2020-12-31 | 1.045 | 0.347 | 0.190 |
2020-09-30 | 1.061 | 0.339 | 0.175 |
2020-06-30 | 1.051 | 0.335 | 0.164 |
FELE Price Target
For more insight on analysts targets of FELE, see our FELE price target page. And for a list of of all stocks sorted by upside potential based on analyst target price, see our Top Price Target page.
Average Price Target | $90.33 | Average Broker Recommendation | 1.6 (Moderate Buy) |
Franklin Electric Co., Inc. (FELE) Company Bio
Franklin Electric Company engages in the production and marketing of systems and components for the movement of water and automotive fuels. The company serves customers around the world in residential, commercial, agricultural, industrial, municipal, and fueling applications. The company was founded in 1944 and is based in Fort Wayne, Indiana.
Latest FELE News From Around the Web
Below are the latest news stories about FRANKLIN ELECTRIC CO INC that investors may wish to consider to help them evaluate FELE as an investment opportunity.
Franklin Electric (NASDAQ:FELE) Shareholders Will Want The ROCE Trajectory To ContinueDid you know there are some financial metrics that can provide clues of a potential multi-bagger? Amongst other things... |
Why Franklin Electric Co., Inc. (NASDAQ:FELE) Could Be Worth WatchingFranklin Electric Co., Inc. ( NASDAQ:FELE ), might not be a large cap stock, but it saw significant share price... |
4 No-Brainer Stocks to Buy With $200 Right NowA basket of these industrial stocks under $200 offers decades of market-beating potential to investors. |
Franklin Electric Co., Inc. (NASDAQ:FELE) Looks Interesting, And It's About To Pay A DividendSome investors rely on dividends for growing their wealth, and if you're one of those dividend sleuths, you might be... |
Q2 2023 Franklin Electric Co Inc Earnings CallQ2 2023 Franklin Electric Co Inc Earnings Call |
FELE Price Returns
1-mo | -5.76% |
3-mo | -7.68% |
6-mo | 1.31% |
1-year | 9.85% |
3-year | 60.21% |
5-year | 99.72% |
YTD | 13.87% |
2022 | -14.85% |
2021 | 37.80% |
2020 | 22.08% |
2019 | 35.26% |
2018 | -5.61% |
FELE Dividends
Ex-Dividend Date | Type | Payout Amount | Change | ||||||
---|---|---|---|---|---|---|---|---|---|
Loading, please wait... |
Continue Researching FELE
Want to do more research on Franklin Electric Co Inc's stock and its price? Try the links below:Franklin Electric Co Inc (FELE) Stock Price | Nasdaq
Franklin Electric Co Inc (FELE) Stock Quote, History and News - Yahoo Finance
Franklin Electric Co Inc (FELE) Stock Price and Basic Information | MarketWatch
Loading social stream, please wait...