FutureFuel Corp. Common shares (FF): Price and Financial Metrics
FF Price/Volume Stats
Current price | $8.05 | 52-week high | $10.31 |
Prev. close | $8.06 | 52-week low | $5.27 |
Day low | $7.99 | Volume | 417,400 |
Day high | $8.16 | Avg. volume | 508,130 |
50-day MA | $6.20 | Dividend yield | 2.95% |
200-day MA | $7.02 | Market Cap | 352.29M |
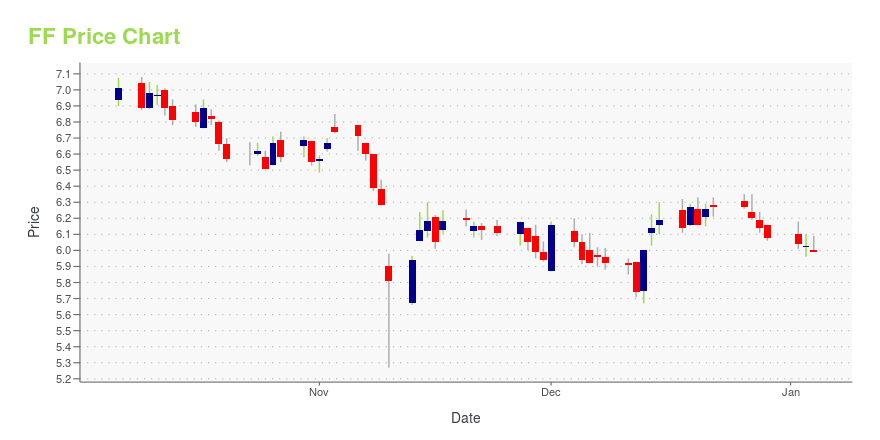
FF Stock Price Chart Interactive Chart >
FF POWR Grades
- FF scores best on the Value dimension, with a Value rank ahead of 92.65% of US stocks.
- FF's strongest trending metric is Growth; it's been moving down over the last 26 weeks.
- FF's current lowest rank is in the Growth metric (where it is better than 16.9% of US stocks).
FF Stock Summary
- Of note is the ratio of FUTUREFUEL CORP's sales and general administrative expense to its total operating expenses; only 17.13% of US stocks have a lower such ratio.
- For FF, its debt to operating expenses ratio is greater than that reported by just 0.22% of US equities we're observing.
- FF's equity multiplier -- a measure of assets relative to shareholders'equity -- is greater than that of only 13.75% of US stocks.
- Stocks with similar financial metrics, market capitalization, and price volatility to FUTUREFUEL CORP are MESO, XPER, CBAT, BHIL, and FSLR.
- FF's SEC filings can be seen here. And to visit FUTUREFUEL CORP's official web site, go to www.futurefuelcorporation.com.
FF Valuation Summary
- In comparison to the median Basic Materials stock, FF's price/sales ratio is 64.1% lower, now standing at 0.7.
- Over the past 155 months, FF's price/sales ratio has gone down 1.1.
Below are key valuation metrics over time for FF.
Stock | Date | P/S | P/B | P/E | EV/EBIT |
---|---|---|---|---|---|
FF | 2023-12-29 | 0.7 | 0.9 | 9.2 | 2.2 |
FF | 2023-12-28 | 0.7 | 0.9 | 9.3 | 2.3 |
FF | 2023-12-27 | 0.7 | 0.9 | 9.4 | 2.4 |
FF | 2023-12-26 | 0.7 | 0.9 | 9.5 | 2.5 |
FF | 2023-12-22 | 0.7 | 0.9 | 9.5 | 2.5 |
FF | 2023-12-21 | 0.7 | 0.9 | 9.5 | 2.5 |
FF Growth Metrics
- Its 2 year net income to common stockholders growth rate is now at -77.75%.
- The year over year price growth rate now stands at -11.94%.
- The 4 year net income to common stockholders growth rate now stands at 106.89%.
The table below shows FF's growth in key financial areas (numbers in millions of US dollars).
Date | Revenue | Operating Cash Flow | Net Income to Common Stock |
---|---|---|---|
2022-09-30 | 385.268 | 68.384 | 22.623 |
2022-06-30 | 365.809 | 44.523 | 16.045 |
2022-03-31 | 322.131 | 47.855 | 22.63 |
2021-12-31 | 321.386 | 44.084 | 26.255 |
2021-09-30 | 264.179 | 39.654 | 9.382 |
2021-06-30 | 219.635 | 9.853 | 7.07 |
FF's Quality Factors
The “Quality” component of the POWR Ratings focuses on 31 different factors of a companies fundamentals and operational strength. Here are some key insights as we drill into the specifics of these quality attributes.- FF has a Quality Grade of C, ranking ahead of 74.16% of graded US stocks.
- FF's asset turnover comes in at 0.53 -- ranking 57th of 89 Chemicals stocks.
- WLK, AVD, and AVNT are the stocks whose asset turnover ratios are most correlated with FF.
The table below shows FF's key quality metrics over time.
Period | Asset Turnover | Gross Margin | ROIC |
---|---|---|---|
2021-06-30 | 0.530 | 0.015 | 0.008 |
2021-03-31 | 0.436 | 0.022 | 0.060 |
2020-12-31 | 0.421 | 0.153 | 0.159 |
2020-09-30 | 0.335 | 0.491 | 0.391 |
2020-06-30 | 0.349 | 0.456 | 0.410 |
2020-03-31 | 0.389 | 0.416 | 0.384 |
FutureFuel Corp. Common shares (FF) Company Bio
FutureFuel Corporation manufactures and sells diversified chemical products, bio-based products, and bio-based specialty chemical products in the United States and internationally. It operates through two segments, Chemicals and Biofuels. The company was founded in 2005 and is based in Clayton, Missouri.
Latest FF News From Around the Web
Below are the latest news stories about FUTUREFUEL CORP that investors may wish to consider to help them evaluate FF as an investment opportunity.
Investors Could Be Concerned With FutureFuel's (NYSE:FF) Returns On CapitalWhat financial metrics can indicate to us that a company is maturing or even in decline? A business that's potentially... |
Calculating The Fair Value Of FutureFuel Corp. (NYSE:FF)Key Insights FutureFuel's estimated fair value is US$5.71 based on Dividend Discount Model With US$5.96 share price... |
FutureFuel (NYSE:FF) investors are sitting on a loss of 39% if they invested five years agoIn order to justify the effort of selecting individual stocks, it's worth striving to beat the returns from a market... |
FutureFuel Releases Third Quarter 2023 ResultsReports Net Income of $2.8 Million or $0.06 per Diluted Share, and Adjusted EBITDA of $9.7 MillionCLAYTON, Mo., Nov. 09, 2023 (GLOBE NEWSWIRE) -- FutureFuel Corp. (NYSE: FF) (“FutureFuel”), a manufacturer of custom and performance chemicals and biofuels, today announced financial results for the third quarter ended September 30, 2023. Third quarter 2023 Financial Highlights (all comparisons are with the third quarter of 2022) Revenues were $116.8 million, compared to $118.1 million.Net income de |
With 43% ownership, FutureFuel Corp. (NYSE:FF) has piqued the interest of institutional investorsKey Insights Significantly high institutional ownership implies FutureFuel's stock price is sensitive to their trading... |
FF Price Returns
1-mo | 39.73% |
3-mo | 33.75% |
6-mo | 14.57% |
1-year | 15.65% |
3-year | -26.90% |
5-year | 7.34% |
YTD | 33.75% |
2023 | -22.78% |
2022 | 9.85% |
2021 | -26.86% |
2020 | 37.61% |
2019 | -20.32% |
FF Dividends
Ex-Dividend Date | Type | Payout Amount | Change | ||||||
---|---|---|---|---|---|---|---|---|---|
Loading, please wait... |
Continue Researching FF
Want to see what other sources are saying about FutureFuel Corp's financials and stock price? Try the links below:FutureFuel Corp (FF) Stock Price | Nasdaq
FutureFuel Corp (FF) Stock Quote, History and News - Yahoo Finance
FutureFuel Corp (FF) Stock Price and Basic Information | MarketWatch
Loading social stream, please wait...