First Hawaiian, Inc. (FHB): Price and Financial Metrics
GET POWR RATINGS... FREE!
FHB POWR Grades
- FHB scores best on the Momentum dimension, with a Momentum rank ahead of 80.45% of US stocks.
- FHB's strongest trending metric is Growth; it's been moving up over the last 177 days.
- FHB ranks lowest in Value; there it ranks in the 11th percentile.
FHB Stock Summary
- For FHB, its debt to operating expenses ratio is greater than that reported by only 0.48% of US equities we're observing.
- With a year-over-year growth in debt of -100%, FIRST HAWAIIAN INC's debt growth rate surpasses just 0% of about US stocks.
- In terms of volatility of its share price, FHB is more volatile than just 5.26% of stocks we're observing.
- Stocks that are quantitatively similar to FHB, based on their financial statements, market capitalization, and price volatility, are AMNB, CFFI, CBAN, GABC, and AUB.
- Visit FHB's SEC page to see the company's official filings. To visit the company's web site, go to www.fhb.com.
FHB Valuation Summary
- In comparison to the median Financial Services stock, FHB's EV/EBIT ratio is 34.23% lower, now standing at 7.3.
- FHB's price/earnings ratio has moved down 2.3 over the prior 79 months.
Below are key valuation metrics over time for FHB.
Stock | Date | P/S | P/B | P/E | EV/EBIT |
---|---|---|---|---|---|
FHB | 2023-01-23 | 4.4 | 1.5 | 13.5 | 7.3 |
FHB | 2023-01-20 | 4.4 | 1.5 | 13.6 | 7.4 |
FHB | 2023-01-19 | 4.3 | 1.5 | 13.4 | 7.2 |
FHB | 2023-01-18 | 4.3 | 1.5 | 13.5 | 7.3 |
FHB | 2023-01-17 | 4.5 | 1.6 | 14.0 | 7.7 |
FHB | 2023-01-13 | 4.6 | 1.6 | 14.2 | 7.9 |
FHB Growth Metrics
- Its 3 year net income to common stockholders growth rate is now at -0.22%.
- The 2 year net cashflow from operations growth rate now stands at 81.62%.
- Its 3 year net cashflow from operations growth rate is now at -8.96%.

The table below shows FHB's growth in key financial areas (numbers in millions of US dollars).
Date | Revenue | Operating Cash Flow | Net Income to Common Stock |
---|---|---|---|
2022-09-30 | 753.593 | 442.063 | 243.119 |
2022-06-30 | 734.88 | 334.673 | 238.38 |
2022-03-31 | 762.448 | 329.187 | 265.761 |
2021-12-31 | 754.475 | 417.125 | 265.735 |
2021-09-30 | 744.4 | 405.222 | 270.452 |
2021-06-30 | 735.531 | 349.149 | 271.274 |
FHB's Quality Factors
The “Quality” component of the POWR Ratings focuses on 31 different factors of a companies fundamentals and operational strength. Here are some key insights as we drill into the specifics of these quality attributes.- FHB has a Quality Grade of C, ranking ahead of 26.38% of graded US stocks.
- FHB's asset turnover comes in at 0.031 -- ranking 356th of 428 Banking stocks.
- CFFN, VBTX, and SMMF are the stocks whose asset turnover ratios are most correlated with FHB.
The table below shows FHB's key quality metrics over time.
Period | Asset Turnover | Gross Margin | ROIC |
---|---|---|---|
2021-09-30 | 0.031 | 1 | 0.017 |
2021-06-30 | 0.032 | 1 | 0.017 |
2021-03-31 | 0.028 | 1 | 0.013 |
2020-12-31 | 0.028 | 1 | 0.012 |
2020-09-30 | 0.029 | 1 | 0.013 |
2020-06-30 | 0.030 | 1 | 0.014 |
FHB Price Target
For more insight on analysts targets of FHB, see our FHB price target page. And for a list of of all stocks sorted by upside potential based on analyst target price, see our Top Price Target page.
Average Price Target | $19.06 | Average Broker Recommendation | 1.88 (Hold) |
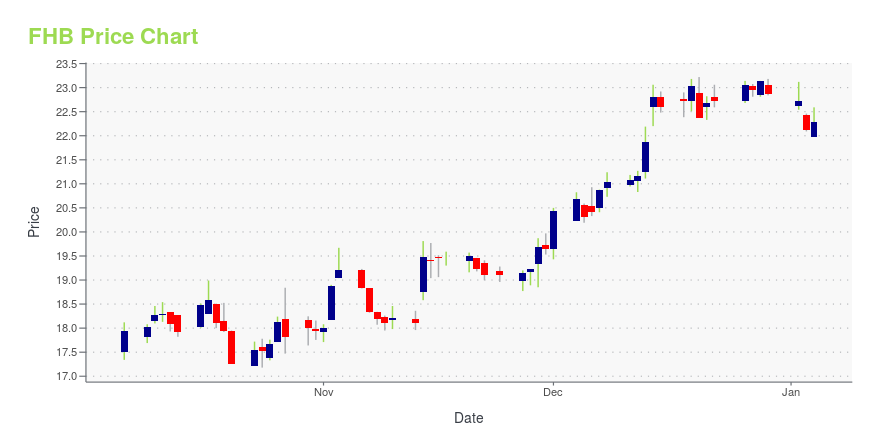
FHB Stock Price Chart Interactive Chart >
FHB Price/Volume Stats
Current price | $25.72 | 52-week high | $30.06 |
Prev. close | $25.44 | 52-week low | $21.21 |
Day low | $25.72 | Volume | 461 |
Day high | $25.72 | Avg. volume | 471,559 |
50-day MA | $25.76 | Dividend yield | 4.09% |
200-day MA | $25.30 | Market Cap | 3.28B |
First Hawaiian, Inc. (FHB) Company Bio
First Hawaiian, Inc., a holding company, through its subsidiaries, provides banking products and services to individuals and businesses in Hawaii. The company was founded in 1973 and is based in San Francisco, California.
Latest FHB News From Around the Web
Below are the latest news stories about FIRST HAWAIIAN INC that investors may wish to consider to help them evaluate FHB as an investment opportunity.
RBB (RBB) Q4 Earnings and Revenues Lag EstimatesRBB (RBB) delivered earnings and revenue surprises of -1.08% and 2.72%, respectively, for the quarter ended December 2022. Do the numbers hold clues to what lies ahead for the stock? |
11 Best Debt Free Stocks to BuyIn this article, we take a look at 11 best debt free stocks to buy. If you want to see more best debt free stocks to buy, go directly to 5 Best Debt Free Stocks to Buy. There are different forms of debt. Short term debt are financial obligations expected to be paid within a […] |
First Hawaiian to Report Fourth Quarter 2022 Financial Results on January 27, 2023HONOLULU, Jan. 06, 2023 (GLOBE NEWSWIRE) -- First Hawaiian, Inc. (NASDAQ: FHB) announced today that it plans to release its fourth quarter 2022 financial results on Friday, January 27, 2023 before the market opens. First Hawaiian will host a conference call to discuss the company’s results on the same day at 1:00 p.m. Eastern Time (8:00 a.m. Hawaii Time). To access the call by phone, participants will need to click on the following registration link: https://register.vevent.com/register/BI73d7ab |
First Hawaiian, Inc. Appoints James M. Moses Chief Financial OfficerJames M. Moses Photo courtesy of First Hawaiian, Inc. HONOLULU, Dec. 14, 2022 (GLOBE NEWSWIRE) -- First Hawaiian, Inc. (NASDAQ:FHB), the parent company of First Hawaiian Bank, announced today that it has appointed James M. Moses as Vice Chairman and Chief Financial Officer (CFO) of First Hawaiian, Inc. and First Hawaiian Bank, effective January 3, 2023. “Jamie brings more than 20 years of diverse banking experience to the team. His track record of driving financial growth in complex organization |
Passing On Alliance Resources And Regional BanksToday, we cross out a number of companies from the screens. That's not because these are bad companies, necessarily, but because they are relying on unpredictable, likely short-term, outside forces to drive their current growth metrics. |
FHB Price Returns
1-mo | 0.82% |
3-mo | 2.01% |
6-mo | 2.90% |
1-year | -5.05% |
3-year | 1.66% |
5-year | 8.92% |
YTD | -1.23% |
2022 | -0.92% |
2021 | 20.39% |
2020 | -13.84% |
2019 | 33.26% |
2018 | -20.12% |
FHB Dividends
Ex-Dividend Date | Type | Payout Amount | Change | ||||||
---|---|---|---|---|---|---|---|---|---|
Loading, please wait... |
Continue Researching FHB
Want to do more research on First Hawaiian Inc's stock and its price? Try the links below:First Hawaiian Inc (FHB) Stock Price | Nasdaq
First Hawaiian Inc (FHB) Stock Quote, History and News - Yahoo Finance
First Hawaiian Inc (FHB) Stock Price and Basic Information | MarketWatch
Loading social stream, please wait...