
Financial Institutions, Inc. (FISI): Price and Financial Metrics
FISI Price/Volume Stats
| Current price | $25.80 | 52-week high | $25.84 |
| Prev. close | $24.63 | 52-week low | $15.22 |
| Day low | $24.86 | Volume | 85,300 |
| Day high | $25.84 | Avg. volume | 52,675 |
| 50-day MA | $19.19 | Dividend yield | 5.03% |
| 200-day MA | $18.76 | Market Cap | 398.53M |
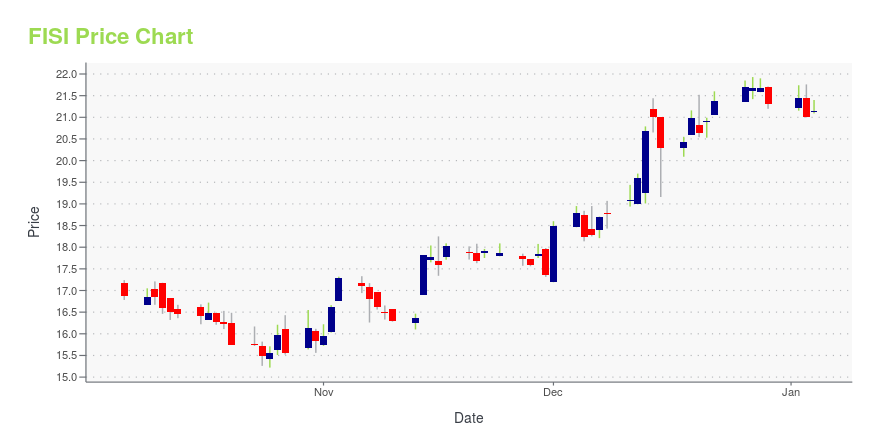
FISI Stock Price Chart Interactive Chart >
Financial Institutions, Inc. (FISI) Company Bio
Financial Institutions, Inc. is a bank holding company for several community banks based in western and central New York. The Company, through subsidiaries, also provides brokerage services, employee benefits, and compensation consulting services. The company was founded in 1931 and is based in Warsaw, New York.
Latest FISI News From Around the Web
Below are the latest news stories about FINANCIAL INSTITUTIONS INC that investors may wish to consider to help them evaluate FISI as an investment opportunity.
Strength Seen in Financial Institutions (FISI): Can Its 5.6% Jump Turn into More Strength?Financial Institutions (FISI) witnessed a jump in share price last session on above-average trading volume. The latest trend in earnings estimate revisions for the stock doesn't suggest further strength down the road. |
Financial Institutions, Inc. (NASDAQ:FISI) Looks Like A Good Stock, And It's Going Ex-Dividend SoonReaders hoping to buy Financial Institutions, Inc. ( NASDAQ:FISI ) for its dividend will need to make their move... |
Financial Institutions, Inc. Announces Leadership ChangesRealignment strengthens the diversified financial services company’s leadership team and streamlines organizational structure in key areas to support future growthWARSAW, N.Y., Dec. 08, 2023 (GLOBE NEWSWIRE) -- Financial Institutions, Inc. (NASDAQ: FISI) (the “Company”), parent company of Five Star Bank (“Five Star”), SDN Insurance Agency, LLC, and Courier Capital, LLC, today announced changes to its executive leadership team and an associated realignment to strengthen its ability to execute on |
With 63% ownership, Financial Institutions, Inc. (NASDAQ:FISI) boasts of strong institutional backingKey Insights Institutions' substantial holdings in Financial Institutions implies that they have significant influence... |
Financial Institutions, Inc. Announces Quarterly Cash DividendWARSAW, N.Y., Nov. 15, 2023 (GLOBE NEWSWIRE) -- Financial Institutions, Inc. (NASDAQ: FISI) (the “Company”), parent company of Five Star Bank, SDN Insurance Agency, LLC, and Courier Capital, LLC, announced today that its Board of Directors has approved a quarterly cash dividend of $0.30 per outstanding common share. The Company also announced dividends of $0.75 per share on its Series A 3% preferred stock and $2.12 per share on its Series B-1 8.48% preferred stock. All dividends are payable Janu |
FISI Price Returns
| 1-mo | 43.89% |
| 3-mo | 49.17% |
| 6-mo | 25.39% |
| 1-year | 52.99% |
| 3-year | 3.99% |
| 5-year | 13.76% |
| YTD | 25.27% |
| 2023 | -6.75% |
| 2022 | -19.99% |
| 2021 | 46.37% |
| 2020 | -26.01% |
| 2019 | 29.19% |
FISI Dividends
| Ex-Dividend Date | Type | Payout Amount | Change | ||||||
|---|---|---|---|---|---|---|---|---|---|
| Loading, please wait... | |||||||||
Continue Researching FISI
Want to see what other sources are saying about Financial Institutions Inc's financials and stock price? Try the links below:Financial Institutions Inc (FISI) Stock Price | Nasdaq
Financial Institutions Inc (FISI) Stock Quote, History and News - Yahoo Finance
Financial Institutions Inc (FISI) Stock Price and Basic Information | MarketWatch
Loading social stream, please wait...