Flowserve Corporation (FLS): Price and Financial Metrics
FLS Price/Volume Stats
Current price | $32.55 | 52-week high | $38.86 |
Prev. close | $33.97 | 52-week low | $23.89 |
Day low | $32.54 | Volume | 1,032,400 |
Day high | $34.02 | Avg. volume | 860,715 |
50-day MA | $33.66 | Dividend yield | 2.36% |
200-day MA | $31.58 | Market Cap | 4.27B |
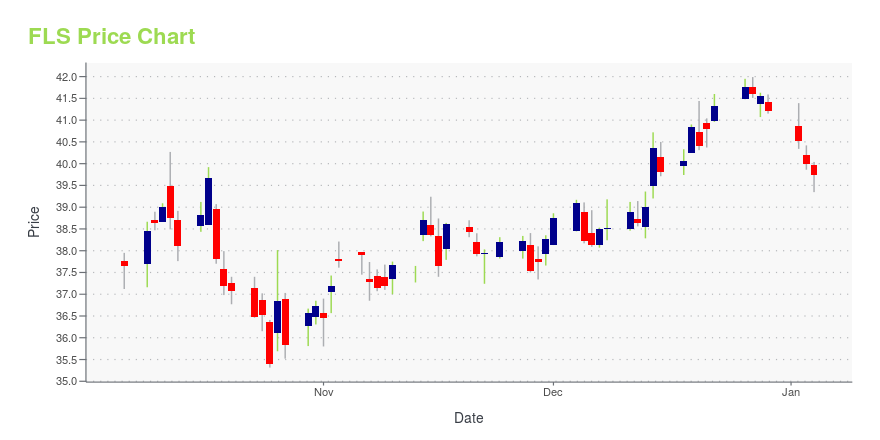
FLS Stock Price Chart Interactive Chart >
FLS POWR Grades
- FLS scores best on the Momentum dimension, with a Momentum rank ahead of 94.28% of US stocks.
- FLS's strongest trending metric is Sentiment; it's been moving up over the last 179 days.
- FLS ranks lowest in Quality; there it ranks in the 49th percentile.
FLS Stock Summary
- FLS's went public 33.19 years ago, making it older than 86.5% of listed US stocks we're tracking.
- Price to trailing twelve month operating cash flow for FLS is currently 330.16, higher than 99.12% of US stocks with positive operating cash flow.
- Of note is the ratio of FLOWSERVE CORP's sales and general administrative expense to its total operating expenses; 98.05% of US stocks have a lower such ratio.
- Stocks that are quantitatively similar to FLS, based on their financial statements, market capitalization, and price volatility, are SXT, VRT, GOLF, MNTX, and IHT.
- Visit FLS's SEC page to see the company's official filings. To visit the company's web site, go to www.flowserve.com.
FLS Valuation Summary
- In comparison to the median Industrials stock, FLS's EV/EBIT ratio is 49.04% higher, now standing at 23.4.
- Over the past 243 months, FLS's price/sales ratio has gone up 0.8.
Below are key valuation metrics over time for FLS.
Stock | Date | P/S | P/B | P/E | EV/EBIT |
---|---|---|---|---|---|
FLS | 2023-05-19 | 1.2 | 2.5 | 19.9 | 23.4 |
FLS | 2023-05-18 | 1.2 | 2.5 | 20.0 | 23.5 |
FLS | 2023-05-17 | 1.2 | 2.5 | 19.7 | 23.3 |
FLS | 2023-05-16 | 1.2 | 2.5 | 19.6 | 23.2 |
FLS | 2023-05-15 | 1.2 | 2.5 | 20.0 | 23.5 |
FLS | 2023-05-12 | 1.2 | 2.5 | 19.8 | 23.4 |
FLS Growth Metrics
- Its 3 year net cashflow from operations growth rate is now at -46.59%.
- The year over year net cashflow from operations growth rate now stands at -37.6%.
- The year over year price growth rate now stands at -18.76%.

The table below shows FLS's growth in key financial areas (numbers in millions of US dollars).
Date | Revenue | Operating Cash Flow | Net Income to Common Stock |
---|---|---|---|
2022-09-30 | 3,495.617 | -10.473 | 84.09 |
2022-06-30 | 3,488.854 | 117.446 | 95.475 |
2022-03-31 | 3,504.81 | 186.968 | 96.049 |
2021-12-31 | 3,541.06 | 250.119 | 125.949 |
2021-09-30 | 3,606.015 | 346.015 | 166.506 |
2021-06-30 | 3,664.198 | 350.612 | 167.725 |
FLS's Quality Factors
The “Quality” component of the POWR Ratings focuses on 31 different factors of a companies fundamentals and operational strength. Here are some key insights as we drill into the specifics of these quality attributes.- FLS has a Quality Grade of C, ranking ahead of 62.01% of graded US stocks.
- FLS's asset turnover comes in at 0.702 -- ranking 51st of 104 Machinery stocks.
- ROLL, LIQT, and CW are the stocks whose asset turnover ratios are most correlated with FLS.
The table below shows FLS's key quality metrics over time.
Period | Asset Turnover | Gross Margin | ROIC |
---|---|---|---|
2021-09-30 | 0.702 | 0.300 | 0.068 |
2021-06-30 | 0.729 | 0.304 | 0.074 |
2021-03-31 | 0.736 | 0.298 | 0.064 |
2020-12-31 | 0.745 | 0.300 | 0.068 |
2020-09-30 | 0.778 | 0.306 | 0.076 |
2020-06-30 | 0.809 | 0.313 | 0.085 |
FLS Price Target
For more insight on analysts targets of FLS, see our FLS price target page. And for a list of of all stocks sorted by upside potential based on analyst target price, see our Top Price Target page.
Average Price Target | $44.73 | Average Broker Recommendation | 1.83 (Hold) |
Flowserve Corporation (FLS) Company Bio
Flowserve produces engineered and industrial pumps, seals and valves as well as a range of related flow management services. The company was founded in 1912 and is based in Irving, Texas.
Latest FLS News From Around the Web
Below are the latest news stories about FLOWSERVE CORP that investors may wish to consider to help them evaluate FLS as an investment opportunity.
Flowserve Corporation's (NYSE:FLS) Fundamentals Look Pretty Strong: Could The Market Be Wrong About The Stock?It is hard to get excited after looking at Flowserve's (NYSE:FLS) recent performance, when its stock has declined 3.7... |
Top Analyst Reports for Exxon Mobil, Costco & Activision BlizzardToday's Research Daily features new research reports on 16 major stocks, including Exxon Mobil Corporation (XOM), Costco Wholesale Corporation (COST), and Activision Blizzard, Inc. (ATVI). |
Flowserve (FLS) Q1 Earnings & Revenues Beat, 2023 View RaisedFlowserve's (FLS) first-quarter 2023 results benefit from robust performance in its Flowserve Pump Division and Flow Control Division segments. |
Best Momentum Stocks to Buy for May 5thVREX, LGND and FLS made it to the Zacks Rank #1 (Strong Buy) momentum stocks list on May 5, 2023. |
Best Growth Stocks to Buy for May 5thVRT, FLS and TEX made it to the Zacks Rank #1 (Strong Buy) growth stocks list on May 5, 2023. |
FLS Price Returns
1-mo | -7.34% |
3-mo | -6.75% |
6-mo | 3.03% |
1-year | 6.09% |
3-year | 29.87% |
5-year | -10.82% |
YTD | 6.77% |
2022 | 3.08% |
2021 | -15.08% |
2020 | -23.85% |
2019 | 33.66% |
2018 | -8.20% |
FLS Dividends
Ex-Dividend Date | Type | Payout Amount | Change | ||||||
---|---|---|---|---|---|---|---|---|---|
Loading, please wait... |
Continue Researching FLS
Want to see what other sources are saying about Flowserve Corp's financials and stock price? Try the links below:Flowserve Corp (FLS) Stock Price | Nasdaq
Flowserve Corp (FLS) Stock Quote, History and News - Yahoo Finance
Flowserve Corp (FLS) Stock Price and Basic Information | MarketWatch
Loading social stream, please wait...