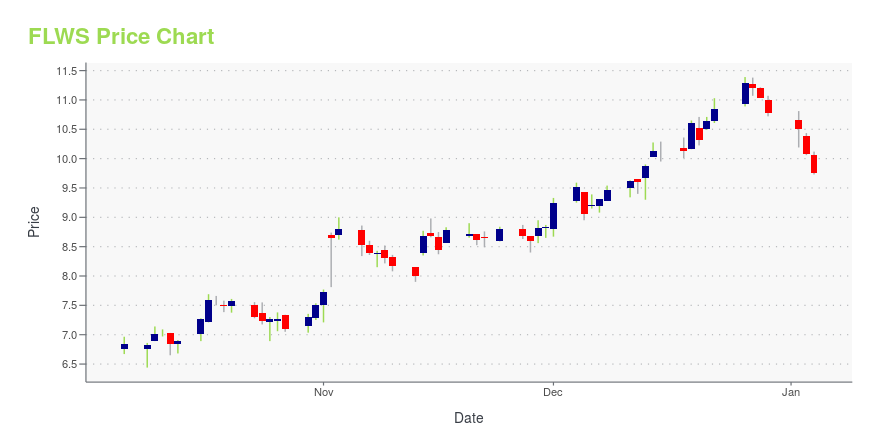
1-800 FLOWERS.COM, Inc. - (FLWS): Price and Financial Metrics
FLWS Price/Volume Stats
Current price | $8.33 | 52-week high | $13.29 |
Prev. close | $7.74 | 52-week low | $5.82 |
Day low | $7.75 | Volume | 602,600 |
Day high | $8.63 | Avg. volume | 630,012 |
50-day MA | $9.78 | Dividend yield | N/A |
200-day MA | $8.93 | Market Cap | 539.58M |
FLWS Stock Price Chart Interactive Chart >
FLWS POWR Grades
- Sentiment is the dimension where FLWS ranks best; there it ranks ahead of 93.13% of US stocks.
- The strongest trend for FLWS is in Growth, which has been heading up over the past 179 days.
- FLWS's current lowest rank is in the Stability metric (where it is better than 8.32% of US stocks).
FLWS Stock Summary
- The capital turnover (annual revenue relative to shareholder's equity) for FLWS is 4.28 -- better than 88.69% of US stocks.
- With a price/sales ratio of 0.28, 1 800 FLOWERS COM INC has a higher such ratio than just 10.05% of stocks in our set.
- Over the past twelve months, FLWS has reported earnings growth of -152.6%, putting it ahead of merely 10.44% of US stocks in our set.
- Stocks that are quantitatively similar to FLWS, based on their financial statements, market capitalization, and price volatility, are UUU, TC, ASUR, IOSP, and CMCO.
- Visit FLWS's SEC page to see the company's official filings. To visit the company's web site, go to www.1800flowers.com.
FLWS Valuation Summary
- In comparison to the median Consumer Cyclical stock, FLWS's EV/EBIT ratio is 240.79% lower, now standing at -19.5.
- FLWS's price/sales ratio has moved down 0.6 over the prior 243 months.
Below are key valuation metrics over time for FLWS.
Stock | Date | P/S | P/B | P/E | EV/EBIT |
---|---|---|---|---|---|
FLWS | 2023-05-19 | 0.3 | 1.3 | -14.4 | -19.5 |
FLWS | 2023-05-18 | 0.3 | 1.3 | -14.8 | -19.9 |
FLWS | 2023-05-17 | 0.3 | 1.3 | -14.5 | -19.6 |
FLWS | 2023-05-16 | 0.3 | 1.3 | -14.2 | -19.3 |
FLWS | 2023-05-15 | 0.3 | 1.2 | -13.6 | -18.7 |
FLWS | 2023-05-12 | 0.3 | 1.2 | -13.4 | -18.5 |
FLWS Growth Metrics
- Its 3 year net cashflow from operations growth rate is now at -106.82%.
- Its 2 year price growth rate is now at -48.4%.
- The 3 year net income to common stockholders growth rate now stands at 87.01%.

The table below shows FLWS's growth in key financial areas (numbers in millions of US dollars).
Date | Revenue | Operating Cash Flow | Net Income to Common Stock |
---|---|---|---|
2022-12-31 | 2,156.949 | 13.001 | 3.179 |
2022-09-30 | 2,202.116 | 9.03 | 9.117 |
2022-06-30 | 2,207.885 | 5.189 | 29.61 |
2022-03-31 | 2,208.976 | -6.193 | 65.17 |
2021-12-31 | 2,213.634 | 42.491 | 90.006 |
2021-09-30 | 2,147.846 | 113.834 | 115.215 |
FLWS's Quality Factors
The “Quality” component of the POWR Ratings focuses on 31 different factors of a companies fundamentals and operational strength. Here are some key insights as we drill into the specifics of these quality attributes.- FLWS has a Quality Grade of C, ranking ahead of 60.1% of graded US stocks.
- FLWS's asset turnover comes in at 1.956 -- ranking 52nd of 165 Retail stocks.
- PRTS, TCS, and HIBB are the stocks whose asset turnover ratios are most correlated with FLWS.
The table below shows FLWS's key quality metrics over time.
Period | Asset Turnover | Gross Margin | ROIC |
---|---|---|---|
2021-06-27 | 1.956 | 0.422 | 0.303 |
2021-03-28 | 2.034 | 0.423 | 0.327 |
2020-12-27 | 2.019 | 0.426 | 0.313 |
2020-09-27 | 1.932 | 0.417 | 0.205 |
2020-06-28 | 1.977 | 0.418 | 0.200 |
2020-03-29 | 1.871 | 0.419 | 0.144 |
FLWS Price Target
For more insight on analysts targets of FLWS, see our FLWS price target page. And for a list of of all stocks sorted by upside potential based on analyst target price, see our Top Price Target page.
Average Price Target | $49.71 | Average Broker Recommendation | 1.44 (Moderate Buy) |
1-800 FLOWERS.COM, Inc. - (FLWS) Company Bio
1-800-FLOWERS.COM, Inc. operates in three segments: Consumer Floral, Gourmet Food and Gift Baskets, and BloomNet Wire Service. It offers various products, such as fresh-cut flowers, floral and fruit arrangements and plants, gifts, popcorn, gourmet foods and gift baskets, cookies, chocolates, candies, wine, candles, balloons, and plush stuffed animals. The company was founded in 1976 and is based in Carle Place, New York.
Latest FLWS News From Around the Web
Below are the latest news stories about 1 800 FLOWERS COM INC that investors may wish to consider to help them evaluate FLWS as an investment opportunity.
1-800-FLOWERS.COM (NASDAQ:FLWS) shareholders have endured a 62% loss from investing in the stock three years agoThe truth is that if you invest for long enough, you're going to end up with some losing stocks. But the long term... |
Hero or Zero? 7 Speculative Small-Cap Stocks to Make You Rich… or Broke.While lesser-known enterprises present viability risks, those wanting to swing for the fences should seek small-cap stocks to buy. |
AI bot 'Momverse' is writing poems for Mother's Day this yearThe Yahoo Finance Live team discusses the new AI bot from 1800FLOWERS, 'Momverse', writing poems for Mother's Day this year. |
Q3 2023 1-800-Flowers.Com Inc Earnings CallQ3 2023 1-800-Flowers.Com Inc Earnings Call |
1-800-FLOWERS seeks to give 'choice of price point, product' for every budget, occasion: CEO1-800-FLOWERS.COM CEO Chris McCann joins Yahoo Finance Live to discuss the company's Q3 earnings, consumer spending, and the launch of its AI bot. |
FLWS Price Returns
1-mo | 5.18% |
3-mo | -17.77% |
6-mo | -1.65% |
1-year | -16.70% |
3-year | -63.50% |
5-year | -34.92% |
YTD | -12.87% |
2022 | -59.09% |
2021 | -10.12% |
2020 | 79.31% |
2019 | 18.56% |
2018 | 14.30% |
Continue Researching FLWS
Want to do more research on 1 800 Flowers Com Inc's stock and its price? Try the links below:1 800 Flowers Com Inc (FLWS) Stock Price | Nasdaq
1 800 Flowers Com Inc (FLWS) Stock Quote, History and News - Yahoo Finance
1 800 Flowers Com Inc (FLWS) Stock Price and Basic Information | MarketWatch
Loading social stream, please wait...