
Flexsteel Industries, Inc. (FLXS): Price and Financial Metrics
FLXS Price/Volume Stats
| Current price | $38.45 | 52-week high | $41.64 |
| Prev. close | $37.85 | 52-week low | $15.67 |
| Day low | $37.80 | Volume | 17,462 |
| Day high | $38.95 | Avg. volume | 33,394 |
| 50-day MA | $34.22 | Dividend yield | 1.58% |
| 200-day MA | $29.14 | Market Cap | 198.25M |
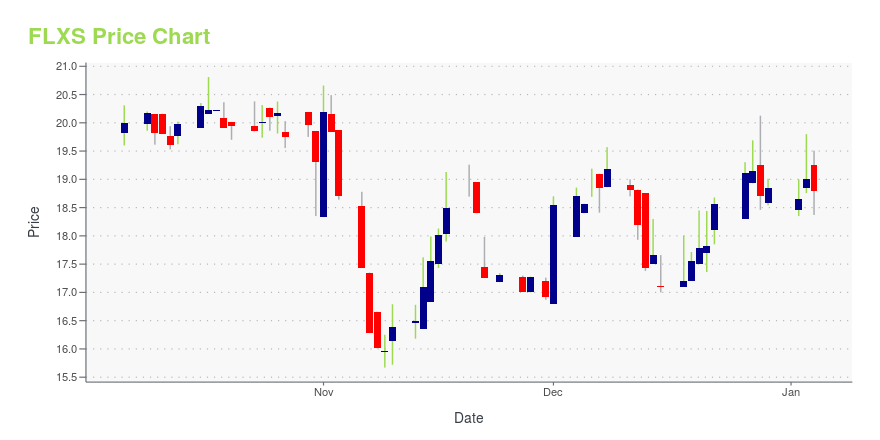
FLXS Stock Price Chart Interactive Chart >
Flexsteel Industries, Inc. (FLXS) Company Bio
Flexsteel Industries, Inc. manufactures, imports, and markets residential and commercial upholstered and wood furniture products in the United States. The company was founded in 1929 and is based in Dubuque, Iowa.
Latest FLXS News From Around the Web
Below are the latest news stories about FLEXSTEEL INDUSTRIES INC that investors may wish to consider to help them evaluate FLXS as an investment opportunity.
Flexsteel Industries, Inc. (NASDAQ:FLXS) Q1 2024 Earnings Call TranscriptFlexsteel Industries, Inc. (NASDAQ:FLXS) Q1 2024 Earnings Call Transcript November 4, 2023 Operator: Good morning, and welcome to the Flexsteel Industries First Quarter Fiscal Year 2024 Earnings Conference Call. All participants will be in a listen-only mode. [Operator Instructions] After today’s presentation, there will be an opportunity to ask questions. [Operator Instructions] Please note this […] |
Flexsteel Industries, Inc. Reports Fiscal First Quarter 2024 ResultsDUBUQUE, Iowa, October 31, 2023--Flexsteel Industries, Inc. (NASDAQ: FLXS) ("Flexsteel" or the "Company"), one of the largest manufacturers, importers, and marketers of residential furniture products in the United States, today reported first quarter fiscal 2024 results. |
WillScot (WSC) Earnings Expected to Grow: Should You Buy?WillScot (WSC) doesn't possess the right combination of the two key ingredients for a likely earnings beat in its upcoming report. Get prepared with the key expectations. |
Flexsteel Industries (FLXS) Reports Next Week: Wall Street Expects Earnings GrowthFlexsteel (FLXS) doesn't possess the right combination of the two key ingredients for a likely earnings beat in its upcoming report. Get prepared with the key expectations. |
Flexsteel Industries, Inc. to Announce First Quarter 2024 Results on October 31DUBUQUE, Iowa, October 16, 2023--Flexsteel Industries, Inc. (NASDAQ:FLXS) ("Flexsteel" or the "Company"), one of the largest manufacturers, importers and marketers of residential furniture products in the United States, announced today that it will issue its first quarter 2024 financial results after market close on Tuesday, October 31, 2023. |
FLXS Price Returns
| 1-mo | 25.61% |
| 3-mo | 2.74% |
| 6-mo | 34.83% |
| 1-year | 99.51% |
| 3-year | 18.14% |
| 5-year | 164.97% |
| YTD | 105.86% |
| 2023 | 26.12% |
| 2022 | -40.70% |
| 2021 | -21.76% |
| 2020 | 80.92% |
| 2019 | -5.52% |
FLXS Dividends
| Ex-Dividend Date | Type | Payout Amount | Change | ||||||
|---|---|---|---|---|---|---|---|---|---|
| Loading, please wait... | |||||||||
Continue Researching FLXS
Want to do more research on Flexsteel Industries Inc's stock and its price? Try the links below:Flexsteel Industries Inc (FLXS) Stock Price | Nasdaq
Flexsteel Industries Inc (FLXS) Stock Quote, History and News - Yahoo Finance
Flexsteel Industries Inc (FLXS) Stock Price and Basic Information | MarketWatch
Loading social stream, please wait...