F.N.B. Corporation (FNB): Price and Financial Metrics
GET POWR RATINGS... FREE!
FNB POWR Grades
- FNB scores best on the Momentum dimension, with a Momentum rank ahead of 89.62% of US stocks.
- FNB's strongest trending metric is Momentum; it's been moving up over the last 179 days.
- FNB ranks lowest in Quality; there it ranks in the 29th percentile.
FNB Stock Summary
- FNB's equity multiplier -- a measure of assets relative to shareholders'equity -- is greater than that of 86.3% of US stocks.
- With a year-over-year growth in debt of -23.49%, Fnb Corp's debt growth rate surpasses only 17.22% of about US stocks.
- Shareholder yield, a measure of how much is returned to shareholders via dividends and share repurchases, for FNB comes in at 19% -- higher than that of 90.95% of stocks in our set.
- Stocks that are quantitatively similar to FNB, based on their financial statements, market capitalization, and price volatility, are ASB, TRST, PBHC, HTH, and FCF.
- Visit FNB's SEC page to see the company's official filings. To visit the company's web site, go to www.fnb-online.com.
FNB Valuation Summary
- In comparison to the median Financial Services stock, FNB's price/earnings ratio is 2.73% lower, now standing at 10.7.
- FNB's price/sales ratio has moved down 0.1 over the prior 243 months.
Below are key valuation metrics over time for FNB.
Stock | Date | P/S | P/B | P/E | EV/EBIT |
---|---|---|---|---|---|
FNB | 2021-05-27 | 3.8 | 0.9 | 13.3 | 11.1 |
FNB | 2015-04-07 | 3.9 | 1.1 | 16.8 | 22.2 |
FNB | 2014-07-22 | 3.8 | 1.1 | 16.6 | 19.3 |
FNB | 2010-08-03 | 3.2 | 1.0 | 29.0 | 36.1 |
FNB | 2010-06-28 | 3.2 | 0.9 | 28.7 | 35.9 |
FNB | 2007-04-02 | 3.9 | 1.9 | 14.9 | 19.8 |
FNB Growth Metrics
- The 5 year cash and equivalents growth rate now stands at 63.03%.
- Its 3 year net cashflow from operations growth rate is now at 66.34%.
- Its 2 year net income to common stockholders growth rate is now at 30.22%.

The table below shows FNB's growth in key financial areas (numbers in millions of US dollars).
Date | Revenue | Operating Cash Flow | Net Income to Common Stock |
---|---|---|---|
2021-12-31 | 1,236 | 530 | 397 |
2021-09-30 | 1,215 | 578 | 370 |
2021-06-30 | 1,173 | 571 | 342 |
2021-03-31 | 1,140 | 533 | 324 |
2020-12-31 | 1,093 | 113 | 278 |
2020-09-30 | 1,102 | 41 | 301 |
FNB's Quality Factors
The “Quality” component of the POWR Ratings focuses on 31 different factors of a companies fundamentals and operational strength. Here are some key insights as we drill into the specifics of these quality attributes.- FNB has a Quality Grade of C, ranking ahead of 40.98% of graded US stocks.
- FNB's asset turnover comes in at 0.031 -- ranking 357th of 430 Banking stocks.
- FRME, HTLF, and BANR are the stocks whose asset turnover ratios are most correlated with FNB.
The table below shows FNB's key quality metrics over time.
Period | Asset Turnover | Gross Margin | ROIC |
---|---|---|---|
2021-06-30 | 0.031 | 1 | 0.012 |
2021-03-31 | 0.030 | 1 | 0.011 |
2020-12-31 | 0.030 | 1 | 0.009 |
2020-09-30 | 0.030 | 1 | 0.010 |
2020-06-30 | 0.032 | 1 | 0.011 |
2020-03-31 | 0.033 | 1 | 0.011 |
FNB Price Target
For more insight on analysts targets of FNB, see our FNB price target page. And for a list of of all stocks sorted by upside potential based on analyst target price, see our Top Price Target page.
Average Price Target | $14.20 | Average Broker Recommendation | 1.55 (Moderate Buy) |
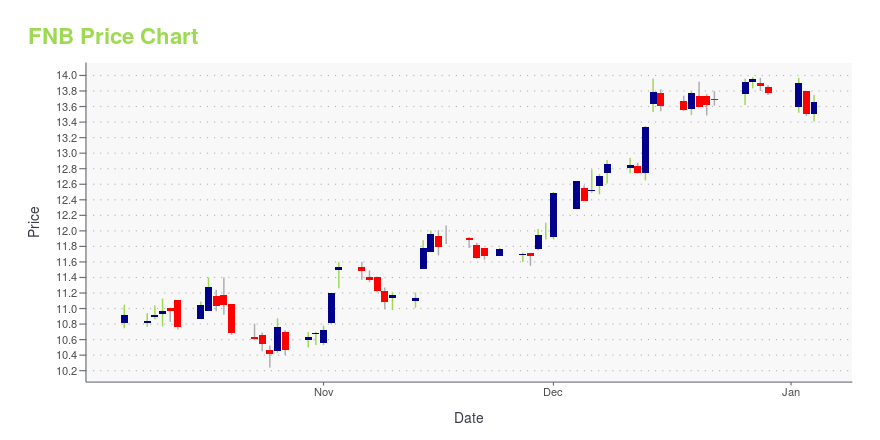
FNB Stock Price Chart Interactive Chart >
FNB Price/Volume Stats
Current price | $10.97 | 52-week high | $14.11 |
Prev. close | $11.07 | 52-week low | $10.48 |
Day low | $10.90 | Volume | 1,777,600 |
Day high | $11.09 | Avg. volume | 2,834,527 |
50-day MA | $11.60 | Dividend yield | 4.38% |
200-day MA | $12.25 | Market Cap | 3.86B |
F.N.B. Corporation (FNB) Company Bio
F.N.B. Corporation provides various financial services to consumers, corporations, governments, and small- to medium-sized businesses primarily in Pennsylvania, eastern Ohio, and northern West Virginia. The company was founded in 1974 and is based in Pittsburgh, Pennsylvania.
Latest FNB News From Around the Web
Below are the latest news stories about Fnb Corp that investors may wish to consider to help them evaluate FNB as an investment opportunity.
F.N.B. (FNB) May Find a Bottom Soon, Here's Why You Should Buy the Stock NowF.N.B. (FNB) witnesses a hammer chart pattern, indicating support found by the stock after losing some value lately. This coupled with an upward trend in earnings estimate revisions could mean a trend reversal for the stock in the near term. |
F.N.B. Corporation Honored for Commercial Banking Client ExperienceF.N.B. Corporation (NYSE: FNB) announced that it again was recognized as a Greenwich Excellence and Best Brand Awards winner by Coalition Greenwich. In 2021, FNB received 17 awards for excellence in middle market and small business banking, making it one of the year's top 10 banks overall based on the total number of awards received and, for the second consecutive year, a top 10 bank based on the number of awards received in the small business banking category. |
Why Is F.N.B. (FNB) Up 2.2% Since Last Earnings Report?F.N.B. (FNB) reported earnings 30 days ago. What's next for the stock? We take a look at earnings estimates for some clues. |
FNB closes 7 Baltimore-area branches after Howard Bank acquisitionFNB closed its acquisition of Howard Bank on Jan. 22 and said it expected to cut costs through consolidation. |
F.N.B. Corporation's Banking Subsidiary Receives National Top Workplace Honors for Second Consecutive YearFirst National Bank, the largest subsidiary of F.N.B. Corporation (NYSE: FNB), announced today it has been named a 2022 Top Workplace USA by Energage, an independent research firm specializing in workplace engagement and organizational health. FNB has received the national award for the second consecutive year, appearing on the list since its inception in 2021. |
FNB Price Returns
1-mo | -8.80% |
3-mo | -11.49% |
6-mo | -7.81% |
1-year | -7.39% |
3-year | 6.39% |
5-year | -4.33% |
YTD | -7.81% |
2021 | 32.83% |
2020 | -20.81% |
2019 | 34.49% |
2018 | -26.16% |
2017 | -10.78% |
FNB Dividends
Ex-Dividend Date | Type | Payout Amount | Change | ||||||
---|---|---|---|---|---|---|---|---|---|
Loading, please wait... |
Continue Researching FNB
Here are a few links from around the web to help you further your research on Fnb Corp's stock as an investment opportunity:Fnb Corp (FNB) Stock Price | Nasdaq
Fnb Corp (FNB) Stock Quote, History and News - Yahoo Finance
Fnb Corp (FNB) Stock Price and Basic Information | MarketWatch
Loading social stream, please wait...