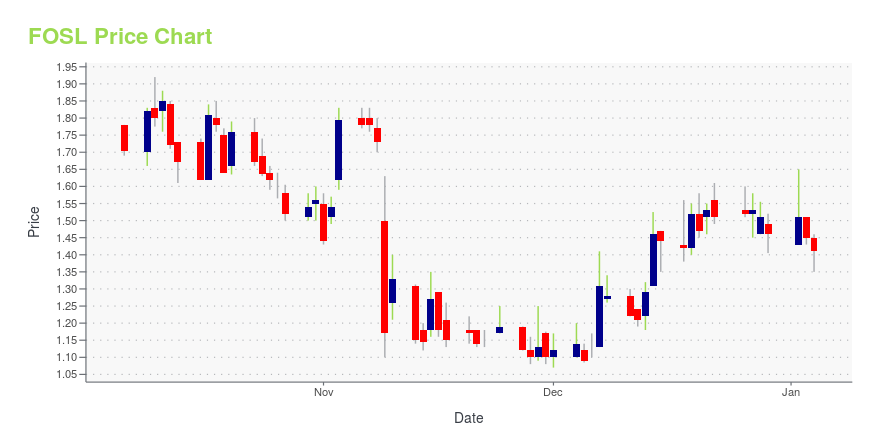
Fossil Group, Inc. (FOSL): Price and Financial Metrics
FOSL Price/Volume Stats
| Current price | $1.29 | 52-week high | $2.84 |
| Prev. close | $1.19 | 52-week low | $0.75 |
| Day low | $1.21 | Volume | 551,500 |
| Day high | $1.29 | Avg. volume | 676,705 |
| 50-day MA | $1.35 | Dividend yield | N/A |
| 200-day MA | $1.23 | Market Cap | 68.02M |
FOSL Stock Price Chart Interactive Chart >
Fossil Group, Inc. (FOSL) Company Bio
Fossil Group is a global design, marketing and distribution company that specializes in consumer lifestyle and fashion accessories. The Company's principal offerings include an extensive line of men's and women's fashion watches and jewelry sold under a diverse portfolio of proprietary and licensed brands, handbags, small leather goods, accessories and apparel. The company was founded in 1984 and is based in Richardson, Texas.
Latest FOSL News From Around the Web
Below are the latest news stories about FOSSIL GROUP INC that investors may wish to consider to help them evaluate FOSL as an investment opportunity.
Fossil Group (NASDAQ:FOSL) adds US$10m to market cap in the past 7 days, though investors from five years ago are still down 90%Fossil Group, Inc. ( NASDAQ:FOSL ) shareholders should be happy to see the share price up 23% in the last month. But... |
Fossil Group Selects NewStore Omnichannel Platform to Transform its Shopping Experience GloballyNewStore, a modular, mobile-first omnichannel cloud platform for retail brands worldwide, today announced Fossil Group, Inc. (NASDAQ: FOSL) is now using the company's technology globally to reimagine the shopping experience across its Fossil, Fossil Outlet, and Watch Station stores. The lifestyle accessories company has replaced its legacy store solution with the NewStore mobile point-of-sale (mPOS), which will be live in hundreds of locations across 19 countries once the project is complete. |
Fossil Group, Inc. (NASDAQ:FOSL) Q3 2023 Earnings Call TranscriptFossil Group, Inc. (NASDAQ:FOSL) Q3 2023 Earnings Call Transcript November 9, 2023 Operator: Good afternoon, ladies and gentlemen and welcome to the Fossil Group Third Quarter 2023 Earnings Conference Call. [Operator Instructions] This conference call is being recorded and may not be reproduced in whole or in part without written permission from the company. I […] |
Q3 2023 Fossil Group Inc Earnings CallQ3 2023 Fossil Group Inc Earnings Call |
Fossil Group, Inc. Reports Third Quarter 2023 Financial ResultsUpdates Full Year 2023 OutlookRICHARDSON, Texas, Nov. 08, 2023 (GLOBE NEWSWIRE) -- Fossil Group, Inc. (NASDAQ: FOSL) today announced financial results for the fiscal third quarter ended September 30, 2023. Third Quarter Summary Third quarter worldwide net sales totaled $344 million, decreasing 21%. Net sales in the Company’s direct to consumer channels were down 12% in constant currency, with a comparable retail sales decrease of 6%. Net sales in our wholesale channels were down 25%. The Company |
FOSL Price Returns
| 1-mo | -14.00% |
| 3-mo | 63.08% |
| 6-mo | 6.61% |
| 1-year | -52.04% |
| 3-year | -89.42% |
| 5-year | -87.78% |
| YTD | -11.64% |
| 2023 | -66.13% |
| 2022 | -58.11% |
| 2021 | 18.69% |
| 2020 | 10.03% |
| 2019 | -49.90% |
Continue Researching FOSL
Here are a few links from around the web to help you further your research on Fossil Group Inc's stock as an investment opportunity:Fossil Group Inc (FOSL) Stock Price | Nasdaq
Fossil Group Inc (FOSL) Stock Quote, History and News - Yahoo Finance
Fossil Group Inc (FOSL) Stock Price and Basic Information | MarketWatch


Loading social stream, please wait...