
Franklin Financial Services Corporation (FRAF): Price and Financial Metrics
FRAF Price/Volume Stats
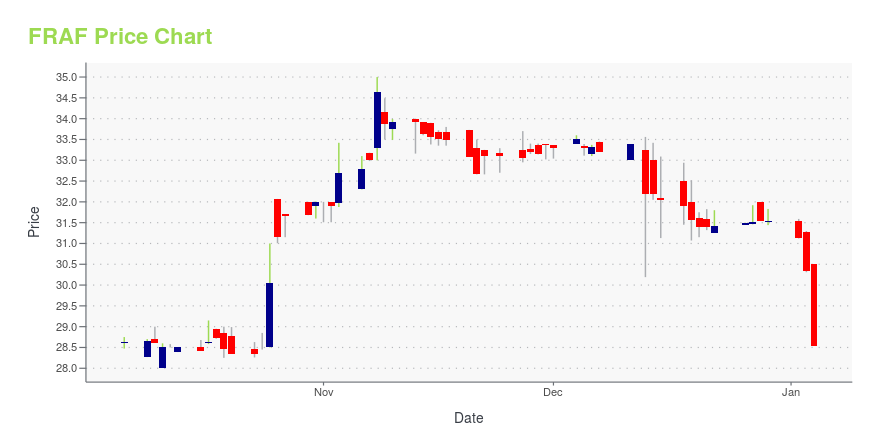
| Current price | $30.95 | 52-week high | $35.00 |
| Prev. close | $30.74 | 52-week low | $25.11 |
| Day low | $30.50 | Volume | 3,900 |
| Day high | $30.95 | Avg. volume | 6,056 |
| 50-day MA | $27.72 | Dividend yield | 4.2% |
| 200-day MA | $29.07 | Market Cap | 136.06M |
FRAF Stock Price Chart Interactive Chart >
Franklin Financial Services Corporation (FRAF) Company Bio
Franklin Financial Services Corporation operates as the bank holding company for Farmers and Merchants Trust Company of Chambersburg that provides commercial, retail banking, and trust services to small and medium-sized businesses, individuals, governmental entities, and non-profit organizations in Pennsylvania. It offers various deposit products, including checking, savings, money management, and time deposit accounts, as well as demand deposits. The company also provides commercial real estate, construction and land development, agricultural, commercial and industrial, and residential mortgage loans, as well as installment and revolving loans to consumers; and secured and unsecured commercial and industrial loans, including accounts receivable and inventory financing, and commercial equipment financing. In addition, it offers various investment and trust services comprising estate planning and administration, corporate and personal trust fund management, pension, and profit sharing and other employee benefit funds management services, as well as custodial services; sells mutual funds, annuities, and insurance products; and offers safe deposit facilities and fiduciary services. Further, the company, through its subsidiary, Franklin Future Fund Inc., operates as a non-bank investment company that makes venture capital investments. It operates twenty-two community banking offices in Franklin, Cumberland, Fulton, and Huntingdon counties in Pennsylvania. Franklin Financial Services Corporation was founded in 1906 and is headquartered in Chambersburg, Pennsylvania.
Latest FRAF News From Around the Web
Below are the latest news stories about FRANKLIN FINANCIAL SERVICES CORP that investors may wish to consider to help them evaluate FRAF as an investment opportunity.
Franklin Financial Services (NASDAQ:FRAF) Has Announced A Dividend Of $0.32The board of Franklin Financial Services Corporation ( NASDAQ:FRAF ) has announced that it will pay a dividend on the... |
Franklin Financial Reports 2023 Q3 and Year-to-Date Results; Declares DividendFranklin Financial Services Corporation (the Corporation) (NASDAQ: FRAF), the bank holding company of F&M Trust (the Bank) headquartered in Chambersburg, PA, reported its third quarter 2023 and year-to-date 2023 financial results. A summary of operating results follows: |
Those who invested in Franklin Financial Services (NASDAQ:FRAF) three years ago are up 42%By buying an index fund, you can roughly match the market return with ease. But if you pick the right individual... |
Franklin Financial Reports 2023 Q2 and Year-to-Date Results; Declares DividendFranklin Financial Services Corporation (the Corporation) (NASDAQ: FRAF), the bank holding company of F&M Trust (the Bank) headquartered in Chambersburg, PA, reported its second quarter 2023 and year-to-date 2023 results. A summary of operating results follows: |
Franklin Financial Reports 2023 Q1 Results; Declares DividendFranklin Financial Services Corporation (the Corporation) (NASDAQ: FRAF), the bank holding company of F&M Trust (the Bank), reported consolidated earnings of $3.3 million ($0.75 per diluted share) for the first quarter and year-to-date period ended March 31, 2023, compared to $3.0 million ($0.67 per diluted share) for the first quarter and year-to-date period ended March 31, 2022, or a 9.3% increase over the comparable quarter, and an 11.9% EPS increase over the comparable quarter. For 2023, the |
FRAF Price Returns
| 1-mo | 10.89% |
| 3-mo | 2.90% |
| 6-mo | -6.16% |
| 1-year | 8.65% |
| 3-year | 1.63% |
| 5-year | 4.23% |
| YTD | 0.11% |
| 2023 | -8.79% |
| 2022 | 13.49% |
| 2021 | 27.52% |
| 2020 | -27.09% |
| 2019 | 26.80% |
FRAF Dividends
| Ex-Dividend Date | Type | Payout Amount | Change | ||||||
|---|---|---|---|---|---|---|---|---|---|
| Loading, please wait... | |||||||||
Continue Researching FRAF
Here are a few links from around the web to help you further your research on Franklin Financial Services Corp's stock as an investment opportunity:Franklin Financial Services Corp (FRAF) Stock Price | Nasdaq
Franklin Financial Services Corp (FRAF) Stock Quote, History and News - Yahoo Finance
Franklin Financial Services Corp (FRAF) Stock Price and Basic Information | MarketWatch
Loading social stream, please wait...