First Merchants Corporation (FRME): Price and Financial Metrics
GET POWR RATINGS... FREE!
FRME POWR Grades
- Stability is the dimension where FRME ranks best; there it ranks ahead of 90.22% of US stocks.
- The strongest trend for FRME is in Growth, which has been heading down over the past 179 days.
- FRME's current lowest rank is in the Growth metric (where it is better than 19.09% of US stocks).
FRME Stock Summary
- Of note is the ratio of First Merchants Corp's sales and general administrative expense to its total operating expenses; 85.61% of US stocks have a lower such ratio.
- Equity multiplier, or assets relative to shareholders' equity, comes in at 8.05 for First Merchants Corp; that's greater than it is for 87.22% of US stocks.
- In terms of volatility of its share price, FRME is more volatile than only 4.11% of stocks we're observing.
- Stocks that are quantitatively similar to FRME, based on their financial statements, market capitalization, and price volatility, are FNLC, WSFS, FL, UBSI, and HMST.
- Visit FRME's SEC page to see the company's official filings. To visit the company's web site, go to www.firstmerchants.com.
FRME Valuation Summary
- In comparison to the median Financial Services stock, FRME's price/earnings ratio is 9.09% higher, now standing at 12.
- FRME's EV/EBIT ratio has moved down 1.6 over the prior 243 months.
Below are key valuation metrics over time for FRME.
Stock | Date | P/S | P/B | P/E | EV/EBIT |
---|---|---|---|---|---|
FRME | 2017-12-27 | 6.7 | 1.6 | 22.5 | 21.6 |
FRME | 2008-11-24 | 2.5 | 1.0 | 12.4 | 20.7 |
FRME | 2006-11-06 | 3.2 | 1.4 | 14.7 | 20.3 |
FRME | 2006-08-09 | 3.0 | 1.3 | 13.5 | 19.5 |
FRME | 2004-03-25 | 3.5 | 1.5 | 16.3 | 18.6 |
FRME | 2002-09-23 | 4.0 | 1.5 | 15.1 | 14.9 |
FRME Growth Metrics
- Its 5 year revenue growth rate is now at 60.45%.
- Its 5 year cash and equivalents growth rate is now at 59.74%.
- The 4 year net cashflow from operations growth rate now stands at 210.48%.

The table below shows FRME's growth in key financial areas (numbers in millions of US dollars).
Date | Revenue | Operating Cash Flow | Net Income to Common Stock |
---|---|---|---|
2021-12-31 | 520.003 | 207.382 | 205.531 |
2021-09-30 | 518.195 | 221.111 | 202.933 |
2021-06-30 | 491.519 | 185.22 | 186.373 |
2021-03-31 | 453.975 | 186.128 | 163.806 |
2020-12-31 | 433.38 | 204.811 | 148.6 |
2020-09-30 | 429.397 | 187.105 | 151.295 |
FRME's Quality Factors
The “Quality” component of the POWR Ratings focuses on 31 different factors of a companies fundamentals and operational strength. Here are some key insights as we drill into the specifics of these quality attributes.- FRME has a Quality Grade of C, ranking ahead of 32.77% of graded US stocks.
- FRME's asset turnover comes in at 0.034 -- ranking 308th of 430 Banking stocks.
- HTLF, EWBC, and FNB are the stocks whose asset turnover ratios are most correlated with FRME.
The table below shows FRME's key quality metrics over time.
Period | Asset Turnover | Gross Margin | ROIC |
---|---|---|---|
2021-06-30 | 0.034 | 1 | 0.016 |
2021-03-31 | 0.032 | 1 | 0.014 |
2020-12-31 | 0.032 | 1 | 0.013 |
2020-09-30 | 0.033 | 1 | 0.013 |
2020-06-30 | 0.034 | 1 | 0.014 |
2020-03-31 | 0.037 | 1 | 0.016 |
FRME Price Target
For more insight on analysts targets of FRME, see our FRME price target page. And for a list of of all stocks sorted by upside potential based on analyst target price, see our Top Price Target page.
Average Price Target | $48.33 | Average Broker Recommendation | 1.42 (Moderate Buy) |
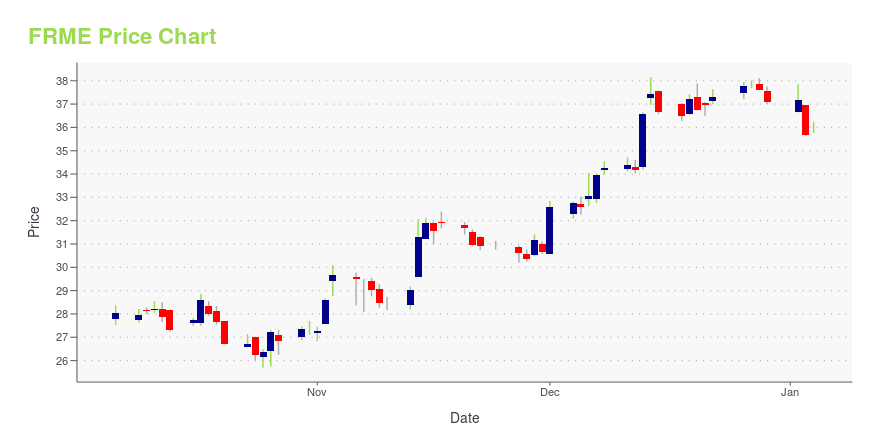
FRME Stock Price Chart Interactive Chart >
FRME Price/Volume Stats
Current price | $36.28 | 52-week high | $46.12 |
Prev. close | $35.62 | 52-week low | $35.07 |
Day low | $35.15 | Volume | 118,700 |
Day high | $36.34 | Avg. volume | 241,964 |
50-day MA | $39.02 | Dividend yield | 3.53% |
200-day MA | $41.47 | Market Cap | 2.16B |
First Merchants Corporation (FRME) Company Bio
First Merchants Corporation provides community banking services in Indiana, Illinois, and Ohio counties. The company was founded in 1893 and is headquartered in Muncie, Indiana.
Latest FRME News From Around the Web
Below are the latest news stories about First Merchants Corp that investors may wish to consider to help them evaluate FRME as an investment opportunity.
First Merchants (NASDAQ:FRME) Could Be A Buy For Its Upcoming DividendFirst Merchants Corporation ( NASDAQ:FRME ) stock is about to trade ex-dividend in four days. The ex-dividend date is... |
Banks - Guggenheim Capital LLC Increases Position in First Merchants CoGuggenheim Capital LLC raised its position in First Merchants Co. by 0.6% during the third quarter, according to the company in its most recent 13F filing with the Securities… |
First Merchants declares $0.29 dividendFirst Merchants (NASDAQ:FRME) declares $0.29/share quarterly dividend, in line with previous.Forward yield 2.62%Payable March 18; for shareholders of record March 4; ex-div March 3.See FRME… |
First Merchants Corporation Announces Cash DividendMUNCIE, Ind., Feb. 09, 2022 (GLOBE NEWSWIRE) -- First Merchants Corporation declared a cash dividend on February 8, 2022 of $0.29 per share. The dividend is payable on March 18, 2022, to shareholders of record as of March 4, 2022. For purposes of broker trading, the ex-date of the cash dividend is March 3, 2022. About First Merchants Corporation: First Merchants Corporation is a financial holding company headquartered in Muncie, Indiana. The Corporation has one full-service bank charter, First M |
BCGM Wealth Management, LLC Buys PowerShares QQQ Trust Ser 1, Apple Inc, First Merchants Corp, ...Investment company BCGM Wealth Management, LLC (Current Portfolio) buys PowerShares QQQ Trust Ser 1, Apple Inc, First Merchants Corp, Nike Inc, American Electric Power Co Inc, sells iShares Core 1-5 Year USD Bond ETF, Vanguard Intermediate-Term Corporate Bond ETF, ARK Innovation ETF, First Trust International IPO ETF, Allakos Inc during the 3-months ended 2021Q4, according to the most recent filings of the investment company, BCGM Wealth Management, LLC. |
FRME Price Returns
1-mo | -9.95% |
3-mo | -9.95% |
6-mo | -18.97% |
1-year | N/A |
3-year | 3.73% |
5-year | 1.98% |
YTD | -12.12% |
2021 | 14.99% |
2020 | -6.93% |
2019 | 24.61% |
2018 | -16.93% |
2017 | 13.63% |
FRME Dividends
Ex-Dividend Date | Type | Payout Amount | Change | ||||||
---|---|---|---|---|---|---|---|---|---|
Loading, please wait... |
Continue Researching FRME
Here are a few links from around the web to help you further your research on First Merchants Corp's stock as an investment opportunity:First Merchants Corp (FRME) Stock Price | Nasdaq
First Merchants Corp (FRME) Stock Quote, History and News - Yahoo Finance
First Merchants Corp (FRME) Stock Price and Basic Information | MarketWatch
Loading social stream, please wait...