Frontline Ltd. (FRO): Price and Financial Metrics
FRO Price/Volume Stats
Current price | $19.34 | 52-week high | $22.95 |
Prev. close | $19.28 | 52-week low | $10.55 |
Day low | $19.14 | Volume | 1,379,700 |
Day high | $19.43 | Avg. volume | 3,211,373 |
50-day MA | $20.82 | Dividend yield | 16.67% |
200-day MA | $17.31 | Market Cap | 4.31B |
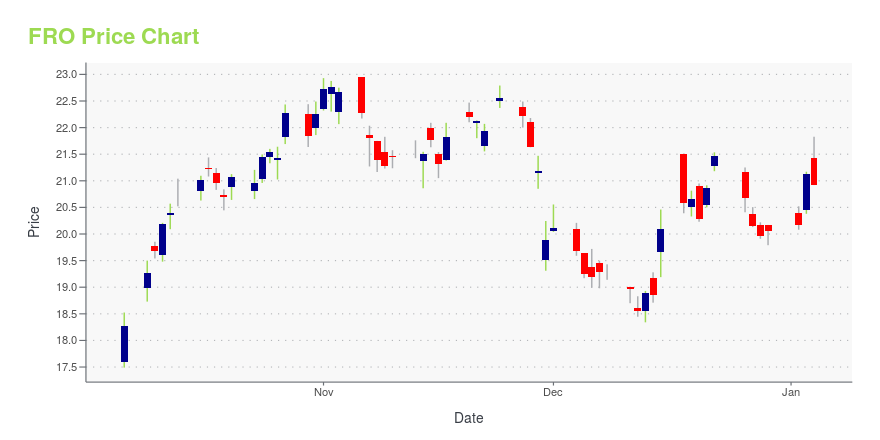
FRO Stock Price Chart Interactive Chart >
FRO POWR Grades
- Momentum is the dimension where FRO ranks best; there it ranks ahead of 98.35% of US stocks.
- FRO's strongest trending metric is Growth; it's been moving down over the last 177 days.
- FRO ranks lowest in Stability; there it ranks in the 27th percentile.
FRO Stock Summary
- With a one year PEG ratio of 0.32, FRONTLINE PLC is expected to have a higher PEG ratio (a measure of how expensive a stock is relative to its expected earnings growth) than just 4.55% of US stocks.
- In terms of twelve month growth in earnings before interest and taxes, FRONTLINE PLC is reporting a growth rate of 2,542.6%; that's higher than 99.31% of US stocks.
- As for revenue growth, note that FRO's revenue has grown 102.37% over the past 12 months; that beats the revenue growth of 94.79% of US companies in our set.
- Stocks that are quantitatively similar to FRO, based on their financial statements, market capitalization, and price volatility, are OSG, CSR, AMPY, LGF.B, and LBRT.
- Visit FRO's SEC page to see the company's official filings. To visit the company's web site, go to www.frontline.bm.
FRO Valuation Summary
- FRO's price/sales ratio is 2.8; this is 64.71% higher than that of the median Energy stock.
- FRO's price/sales ratio has moved down 0.4 over the prior 243 months.
Below are key valuation metrics over time for FRO.
Stock | Date | P/S | P/B | P/E | EV/EBIT |
---|---|---|---|---|---|
FRO | 2023-08-25 | 2.8 | 1.8 | 8.6 | 12.0 |
FRO | 2023-08-24 | 2.8 | 1.8 | 8.4 | 11.8 |
FRO | 2023-08-23 | 2.8 | 1.8 | 8.3 | 11.7 |
FRO | 2023-08-22 | 2.8 | 1.8 | 8.4 | 11.8 |
FRO | 2023-08-21 | 2.8 | 1.8 | 8.4 | 11.8 |
FRO | 2023-08-18 | 2.8 | 1.8 | 8.5 | 11.8 |
FRO Growth Metrics
- The 5 year net cashflow from operations growth rate now stands at 196.7%.
- Its 2 year cash and equivalents growth rate is now at -51.93%.
- Its 3 year net income to common stockholders growth rate is now at -119.86%.

The table below shows FRO's growth in key financial areas (numbers in millions of US dollars).
Date | Revenue | Operating Cash Flow | Net Income to Common Stock |
---|---|---|---|
2022-06-30 | 903.252 | 104.221 | 64.833 |
2022-03-31 | 772.831 | 68.269 | -8.895 |
2021-12-31 | 749.381 | 62.932 | -11.148 |
2021-09-30 | 710.707 | 64.154 | -40.128 |
2021-06-30 | 786.293 | 199.767 | 50.146 |
2021-03-31 | 1,003.359 | 411.339 | 276.439 |
FRO's Quality Factors
The “Quality” component of the POWR Ratings focuses on 31 different factors of a companies fundamentals and operational strength. Here are some key insights as we drill into the specifics of these quality attributes.- FRO has a Quality Grade of D, ranking ahead of 19.3% of graded US stocks.
- FRO's asset turnover comes in at 0.199 -- ranking 95th of 137 Transportation stocks.
- MATX, INSW, and SNDR are the stocks whose asset turnover ratios are most correlated with FRO.
The table below shows FRO's key quality metrics over time.
Period | Asset Turnover | Gross Margin | ROIC |
---|---|---|---|
2021-06-30 | 0.199 | 0.339 | 0.020 |
2021-03-31 | 0.253 | 0.494 | 0.062 |
2020-12-31 | 0.306 | 0.553 | 0.090 |
2020-09-30 | 0.352 | 0.583 | 0.118 |
2020-06-30 | 0.345 | 0.553 | 0.110 |
2020-03-31 | 0.313 | 0.474 | 0.074 |
FRO Price Target
For more insight on analysts targets of FRO, see our FRO price target page. And for a list of of all stocks sorted by upside potential based on analyst target price, see our Top Price Target page.
Average Price Target | $8.25 | Average Broker Recommendation | 1.88 (Hold) |
Frontline Ltd. (FRO) Company Bio
Frontline Ltd. owns and operates oil tankers and oil/bulk/ore carriers. The company provides seaborne transportation of crude oil and oil products. Its carriers transport crude oil from the Middle East Gulf to the Far East, Northern Europe, the Caribbean, and the Louisiana Offshore Oil Port, as well as Suezmax tankers trade in the Atlantic Basin, the Middle East, and Southeast Asia. The company was founded in 1948 and is based in Hamilton, Bermuda.
Latest FRO News From Around the Web
Below are the latest news stories about FRONTLINE PLC that investors may wish to consider to help them evaluate FRO as an investment opportunity.
Frontline Ltd. (NYSE:FRO) Q3 2023 Earnings Call TranscriptFrontline Ltd. (NYSE:FRO) Q3 2023 Earnings Call Transcript November 30, 2023 Frontline Ltd. misses on earnings expectations. Reported EPS is $0.36 EPS, expectations were $0.46. Operator: Good day and thank you for standing by. Welcome to the Q3 2023 Frontline plc Earnings Conference Call. At this time, all participants are in a listen-only mode. [Operator […] |
FRO – Third Quarter and Nine Months 2023 ResultsFRONTLINE PLC REPORTS RESULTS FOR THE THIRD QUARTER ENDED SEPTEMBER 30, 2023 Frontline plc (the “Company” or “Frontline”), today reported unaudited results for the nine months ended September 30, 2023: Highlights Profit of $107.7 million, or $0.48 per basic and diluted share for the third quarter of 2023.Adjusted profit of $80.8 million, or $0.36 per basic and diluted share for the third quarter of 2023.Declared a cash dividend of $0.30 per share for the third quarter of 2023.Reported revenues o |
Frontline (FRO) to Post Q3 Earnings: What's in the Offing?Frontline's (FRO) third-quarter performance is likely to have been hurt by supply-chain disruptions and high fuel costs. |
FRO – Invitation to Q3 2023 Results Conference Call and WebcastFrontline plc.’s preliminary third quarter 2023 results will be released on Thursday November 30, 2023, and a webcast and conference call will be held at 3:00 p.m. CET (9:00 a.m. U.S. Eastern Time). The results presentation will be available for download from the Investor Relations section at www.frontlineplc.cy ahead of the conference call. In order to attend the conference call you may do one of the following: a. WebcastGo to the Investor Relations section at www.frontlineplc.cy and follow the |
FRO – Closing under the Share Purchase Agreement with CMB NVFrontline plc (“Frontline”) (NYSE and OSE: FRO), today announced that the sale by Frontline of 13.7 million shares in Euronav NV (“Euronav”) to CMB NV (“CMB”) has been completed. On 9 October 2023 Frontline announced that it had agreed on an integrated solution to the strategic and structural deadlock in Euronav, where Frontline had entered into agreements with Euronav to acquire a high-quality ECO fleet of 24 VLCCs with an average age of 5.3 years, for an aggregate purchase price of USD 2,350 m |
FRO Price Returns
1-mo | -9.07% |
3-mo | 18.10% |
6-mo | 45.01% |
1-year | 76.26% |
3-year | 252.98% |
5-year | 320.49% |
YTD | 86.28% |
2022 | 73.68% |
2021 | 13.67% |
2020 | -41.47% |
2019 | 134.59% |
2018 | 20.48% |
FRO Dividends
Ex-Dividend Date | Type | Payout Amount | Change | ||||||
---|---|---|---|---|---|---|---|---|---|
Loading, please wait... |
Continue Researching FRO
Here are a few links from around the web to help you further your research on Frontline Ltd's stock as an investment opportunity:Frontline Ltd (FRO) Stock Price | Nasdaq
Frontline Ltd (FRO) Stock Quote, History and News - Yahoo Finance
Frontline Ltd (FRO) Stock Price and Basic Information | MarketWatch
Loading social stream, please wait...