FS Bancorp, Inc. (FSBW): Price and Financial Metrics
FSBW Price/Volume Stats
Current price | $32.35 | 52-week high | $38.70 |
Prev. close | $32.39 | 52-week low | $26.08 |
Day low | $32.21 | Volume | 5,400 |
Day high | $32.60 | Avg. volume | 11,645 |
50-day MA | $34.32 | Dividend yield | 3.24% |
200-day MA | $31.92 | Market Cap | 252.27M |
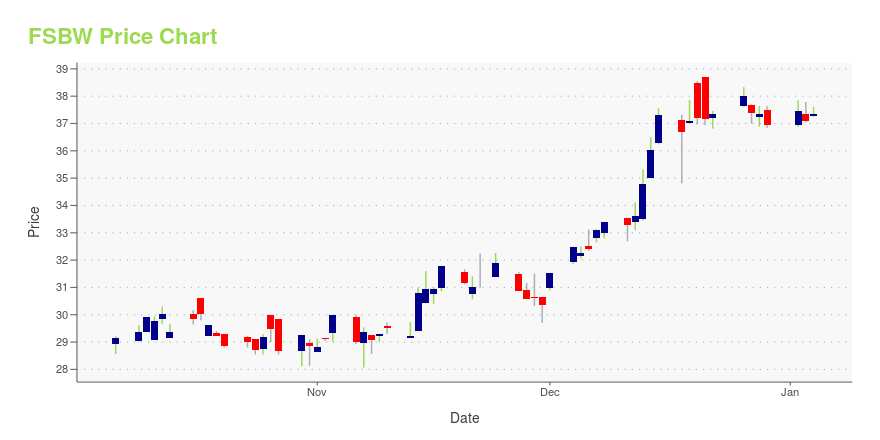
FSBW Stock Price Chart Interactive Chart >
FSBW POWR Grades
- FSBW scores best on the Stability dimension, with a Stability rank ahead of 82.84% of US stocks.
- The strongest trend for FSBW is in Growth, which has been heading down over the past 26 weeks.
- FSBW's current lowest rank is in the Quality metric (where it is better than 22.96% of US stocks).
FSBW Stock Summary
- FSBW's equity multiplier -- a measure of assets relative to shareholders'equity -- is greater than that of 92.68% of US stocks.
- With a year-over-year growth in debt of -43.66%, FS BANCORP INC's debt growth rate surpasses merely 6.58% of about US stocks.
- Shareholder yield, a measure of how much is returned to shareholders via dividends and share repurchases, for FSBW comes in at 50.11% -- higher than that of 96.4% of stocks in our set.
- Stocks with similar financial metrics, market capitalization, and price volatility to FS BANCORP INC are FVCB, SNV, BUSE, CCBG, and CVCY.
- FSBW's SEC filings can be seen here. And to visit FS BANCORP INC's official web site, go to www.fsbwa.com.
FSBW Valuation Summary
- In comparison to the median Financial Services stock, FSBW's price/earnings ratio is 21.82% lower, now standing at 8.6.
- Over the past 139 months, FSBW's price/sales ratio has gone down 0.3.
Below are key valuation metrics over time for FSBW.
Stock | Date | P/S | P/B | P/E | EV/EBIT |
---|---|---|---|---|---|
FSBW | 2023-12-22 | 2.1 | 1.2 | 8.6 | 8.7 |
FSBW | 2023-12-21 | 2.1 | 1.2 | 8.6 | 8.7 |
FSBW | 2023-12-20 | 2.1 | 1.2 | 8.6 | 8.7 |
FSBW | 2023-12-19 | 2.1 | 1.2 | 8.5 | 8.6 |
FSBW | 2023-12-18 | 2.1 | 1.1 | 8.4 | 8.6 |
FSBW | 2023-12-15 | 2.1 | 1.2 | 8.6 | 8.7 |
FSBW Growth Metrics
- The 2 year cash and equivalents growth rate now stands at -43.48%.
- Its 2 year net income to common stockholders growth rate is now at 42.78%.
- Its year over year cash and equivalents growth rate is now at -61.34%.
The table below shows FSBW's growth in key financial areas (numbers in millions of US dollars).
Date | Revenue | Operating Cash Flow | Net Income to Common Stock |
---|---|---|---|
2022-09-30 | 116.327 | 173.43 | 30.676 |
2022-06-30 | 117.39 | 164.564 | 30.549 |
2022-03-31 | 119.583 | 188.752 | 32.399 |
2021-12-31 | 123.662 | 109.009 | 37.412 |
2021-09-30 | 125.152 | 166.6 | 40.127 |
2021-06-30 | 127.463 | 77.653 | 44.509 |
FSBW's Quality Factors
The “Quality” component of the POWR Ratings focuses on 31 different factors of a companies fundamentals and operational strength. Here are some key insights as we drill into the specifics of these quality attributes.- FSBW has a Quality Grade of C, ranking ahead of 42.6% of graded US stocks.
- FSBW's asset turnover comes in at 0.06 -- ranking 72nd of 430 Banking stocks.
- UBCP, KEY, and BOKF are the stocks whose asset turnover ratios are most correlated with FSBW.
The table below shows FSBW's key quality metrics over time.
Period | Asset Turnover | Gross Margin | ROIC |
---|---|---|---|
2021-06-30 | 0.060 | 1 | 0.026 |
2021-03-31 | 0.060 | 1 | 0.027 |
2020-12-31 | 0.058 | 1 | 0.024 |
2020-09-30 | 0.055 | 1 | 0.021 |
2020-06-30 | 0.053 | 1 | 0.019 |
2020-03-31 | 0.053 | 1 | 0.016 |
FSBW Price Target
For more insight on analysts targets of FSBW, see our FSBW price target page. And for a list of of all stocks sorted by upside potential based on analyst target price, see our Top Price Target page.
Average Price Target | $39.17 | Average Broker Recommendation | 1.5 (Moderate Buy) |
FS Bancorp, Inc. (FSBW) Company Bio
FS Bancorp, Inc. operates as a bank holding company for 1st Security Bank of Washington that provides banking and financial services to families, businesses, and industry niches in Washington. The company was founded in 1936 and is based in Mountlake Terrace, Washington.
Latest FSBW News From Around the Web
Below are the latest news stories about FS BANCORP INC that investors may wish to consider to help them evaluate FSBW as an investment opportunity.
1st Security Bank Appoints Dan Icasiano to the Position of SVP, Director of Treasury Management1st Security Bank Announces Appointment Dan Icasiano SVP, Director of Treasury Management MOUNTLAKE TERRACE, Wash., Dec. 18, 2023 (GLOBE NEWSWIRE) -- 1st Security Bank (‘the Bank’) is pleased to announce the appointment of Dan Icasiano to the position of SVP, Director of Treasury Management, effective November 27th. Dan Icasiano’s history of more than thirty years in the banking industry and treasury management services provides a wealth of expertise to 1st Security Bank. CEO, Joe Adams commente |
FS Bancorp, Inc. (NASDAQ:FSBW) is a favorite amongst institutional investors who own 67%Key Insights Institutions' substantial holdings in FS Bancorp implies that they have significant influence over the... |
Heritage Commerce (HTBK) Surges 6.8%: Is This an Indication of Further Gains?Heritage Commerce (HTBK) was a big mover last session on higher-than-average trading volume. The latest trend in earnings estimate revisions might not help the stock continue moving higher in the near term. |
1st Security Bank Announces the Promotion of Sean McCormick to SVP, Director of Credit Administration1st Security Bank Announces Promotion Sean McCormick SVP, Director of Credit Administration MOUNTLAKE TERRACE, Wash., Nov. 22, 2023 (GLOBE NEWSWIRE) -- 1st Security Bank (‘the Bank’) is pleased to announce the promotion of Sean McCormick, currently SVP, Credit Administrator, to the position of SVP, Director of Credit Administration, effective November 1st. Sean joined 1st Security Bank as a Commercial Credit Analyst in 2011. In 2017, he was promoted to Credit Administrator. “Sean’s wealth of cre |
FS Bancorp (NASDAQ:FSBW) Could Be A Buy For Its Upcoming DividendRegular readers will know that we love our dividends at Simply Wall St, which is why it's exciting to see FS Bancorp... |
FSBW Price Returns
1-mo | -5.38% |
3-mo | -12.32% |
6-mo | 11.30% |
1-year | 12.93% |
3-year | 0.72% |
5-year | 49.19% |
YTD | -11.77% |
2023 | 14.11% |
2022 | 2.42% |
2021 | 24.78% |
2020 | -12.42% |
2019 | 50.66% |
FSBW Dividends
Ex-Dividend Date | Type | Payout Amount | Change | ||||||
---|---|---|---|---|---|---|---|---|---|
Loading, please wait... |
Continue Researching FSBW
Here are a few links from around the web to help you further your research on FS Bancorp Inc's stock as an investment opportunity:FS Bancorp Inc (FSBW) Stock Price | Nasdaq
FS Bancorp Inc (FSBW) Stock Quote, History and News - Yahoo Finance
FS Bancorp Inc (FSBW) Stock Price and Basic Information | MarketWatch
Loading social stream, please wait...