
Franklin Street Properties Corp. (FSP): Price and Financial Metrics
FSP Price/Volume Stats
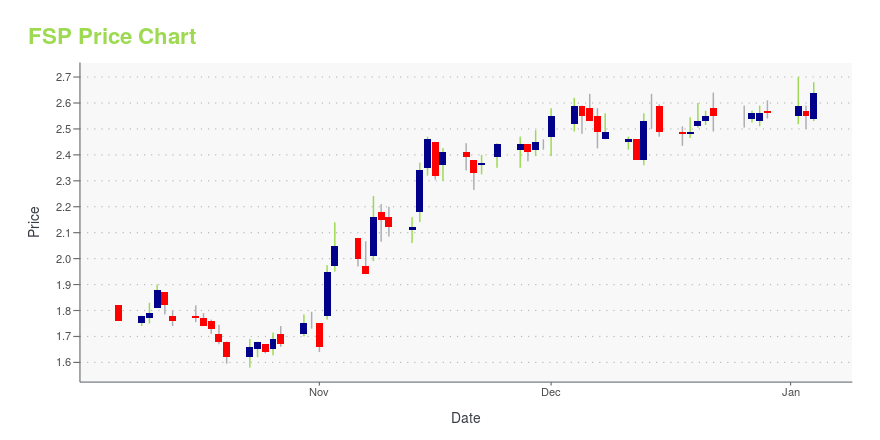
| Current price | $1.81 | 52-week high | $2.72 |
| Prev. close | $1.74 | 52-week low | $1.47 |
| Day low | $1.75 | Volume | 277,599 |
| Day high | $1.81 | Avg. volume | 722,417 |
| 50-day MA | $1.71 | Dividend yield | 2.3% |
| 200-day MA | $2.10 | Market Cap | 187.21M |
FSP Stock Price Chart Interactive Chart >
Franklin Street Properties Corp. (FSP) Company Bio
Franklin Street Properties Corporation is focused on investing in institutional-quality office properties in the U.S. The company is founded in 1997 and is based in Wakefield, Massachusetts.
Latest FSP News From Around the Web
Below are the latest news stories about FRANKLIN STREET PROPERTIES CORP that investors may wish to consider to help them evaluate FSP as an investment opportunity.
5 REITs Under $5 Making Huge Gains This MonthAn entire stock sector may experience a significant decline in value at certain points during market cycles. But as the sector begins to rebound, some of the worst performers may outperform the rest of the group. This trend has borne out in recent weeks as real estate investment trusts (REITs) have bounced off their lows and have been performing exceptionally well. When stocks as a group move higher, lower-priced stocks will often make the biggest percentage gains. One reason is that it's easier |
Franklin Street Properties Corp. (AMEX:FSP) Q3 2023 Earnings Call TranscriptFranklin Street Properties Corp. (AMEX:FSP) Q3 2023 Earnings Call Transcript November 8, 2023 Operator: Good morning and welcome to the Franklin Street Properties Corp. Third Quarter 2023 Earnings Call. [Operator Instructions]. I would now like to turn the call over to Mr. Scott Carter, General Counsel. Please go ahead, sir. Scott Carter: Good morning and […] |
Q3 2023 Franklin Street Properties Corp Earnings CallQ3 2023 Franklin Street Properties Corp Earnings Call |
Franklin Street Properties Corp. Announces Third Quarter 2023 ResultsWAKEFIELD, Mass., November 07, 2023--Franklin Street Properties Corp. (the "Company", "FSP", "we" or "our") (NYSE American: FSP), a real estate investment trust (REIT), announced its results for the third quarter ended September 30, 2023. |
Franklin Street Properties Corp. to Announce Third Quarter 2023 ResultsWAKEFIELD, Mass., October 27, 2023--Franklin Street Properties Corp. (the "Company" or "FSP") (NYSE American: FSP), a real estate investment trust (REIT), announced today that it expects to release its results for the third quarter 2023 after the market closes on Tuesday, November 7, 2023. The Company will hold a conference call/webcast with the investment community to discuss the results at 11:00 AM ET on Wednesday morning, November 8, 2023. |
FSP Price Returns
| 1-mo | 16.74% |
| 3-mo | -8.94% |
| 6-mo | -25.58% |
| 1-year | 20.84% |
| 3-year | -59.29% |
| 5-year | -69.34% |
| YTD | -28.19% |
| 2023 | -4.06% |
| 2022 | -52.29% |
| 2021 | 54.14% |
| 2020 | -45.41% |
| 2019 | 44.00% |
FSP Dividends
| Ex-Dividend Date | Type | Payout Amount | Change | ||||||
|---|---|---|---|---|---|---|---|---|---|
| Loading, please wait... | |||||||||
Continue Researching FSP
Here are a few links from around the web to help you further your research on Franklin Street Properties Corp's stock as an investment opportunity:Franklin Street Properties Corp (FSP) Stock Price | Nasdaq
Franklin Street Properties Corp (FSP) Stock Quote, History and News - Yahoo Finance
Franklin Street Properties Corp (FSP) Stock Price and Basic Information | MarketWatch
Loading social stream, please wait...