Fortress Transportation & Infrastructure Investors LLC (FTAI): Price and Financial Metrics
FTAI Price/Volume Stats
Current price | $35.55 | 52-week high | $37.98 |
Prev. close | $35.71 | 52-week low | $14.56 |
Day low | $35.51 | Volume | 834,200 |
Day high | $36.24 | Avg. volume | 1,060,861 |
50-day MA | $34.94 | Dividend yield | 3.36% |
200-day MA | $28.06 | Market Cap | 3.55B |
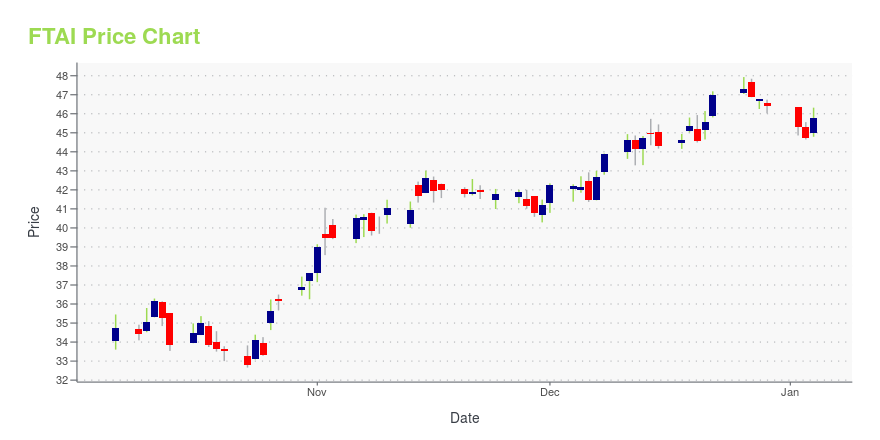
FTAI Stock Price Chart Interactive Chart >
FTAI POWR Grades
- Growth is the dimension where FTAI ranks best; there it ranks ahead of 93.93% of US stocks.
- FTAI's strongest trending metric is Sentiment; it's been moving up over the last 177 days.
- FTAI's current lowest rank is in the Stability metric (where it is better than 16.39% of US stocks).
FTAI Stock Summary
- The capital turnover (annual revenue relative to shareholder's equity) for FTAI is 11.81 -- better than 96.75% of US stocks.
- Equity multiplier, or assets relative to shareholders' equity, comes in at 46.33 for FTAI AVIATION LTD; that's greater than it is for 99% of US stocks.
- In terms of twelve month growth in earnings before interest and taxes, FTAI AVIATION LTD is reporting a growth rate of -879.55%; that's higher than just 1.65% of US stocks.
- Stocks with similar financial metrics, market capitalization, and price volatility to FTAI AVIATION LTD are HESM, DHC, HEP, GOGL, and AES.
- Visit FTAI's SEC page to see the company's official filings. To visit the company's web site, go to www.ftandi.com.
FTAI Valuation Summary
- FTAI's price/earnings ratio is 66.4; this is 256.99% higher than that of the median Industrials stock.
- Over the past 102 months, FTAI's EV/EBIT ratio has gone down 98.3.
Below are key valuation metrics over time for FTAI.
Stock | Date | P/S | P/B | P/E | EV/EBIT |
---|---|---|---|---|---|
FTAI | 2023-09-19 | 3.3 | 38.5 | 66.4 | 23.3 |
FTAI | 2023-09-18 | 3.3 | 38.6 | 66.7 | 23.4 |
FTAI | 2023-09-15 | 3.4 | 39.6 | 68.4 | 23.7 |
FTAI | 2023-09-14 | 3.4 | 39.9 | 68.8 | 23.8 |
FTAI | 2023-09-13 | 3.3 | 38.8 | 66.9 | 23.4 |
FTAI | 2023-09-12 | 3.4 | 39.8 | 68.7 | 23.8 |
FTAI Growth Metrics
- Its 4 year cash and equivalents growth rate is now at -55.5%.
- Its 2 year price growth rate is now at 94.66%.
- The year over year net cashflow from operations growth rate now stands at 10.9%.

The table below shows FTAI's growth in key financial areas (numbers in millions of US dollars).
Date | Revenue | Operating Cash Flow | Net Income to Common Stock |
---|---|---|---|
2022-09-30 | 679.796 | 149.968 | -166.608 |
2022-09-30 | 691.912 | -22.635 | -255.046 |
2022-06-30 | 597.509 | -6.689 | -271.068 |
2022-03-31 | 516.492 | 28.811 | -325.602 |
2021-12-31 | 455.802 | -22.044 | -128.992 |
2021-09-30 | 385.664 | 14.005 | -188.435 |
FTAI's Quality Factors
The “Quality” component of the POWR Ratings focuses on 31 different factors of a companies fundamentals and operational strength. Here are some key insights as we drill into the specifics of these quality attributes.- FTAI has a Quality Grade of F, ranking ahead of 2.49% of graded US stocks.
- FTAI's asset turnover comes in at 0.101 -- ranking 523rd of 561 Business Services stocks.
- VOLT, CTG, and MRIN are the stocks whose asset turnover ratios are most correlated with FTAI.
The table below shows FTAI's key quality metrics over time.
Period | Asset Turnover | Gross Margin | ROIC |
---|---|---|---|
2021-09-30 | 0.101 | 0.644 | -0.003 |
2021-06-30 | 0.096 | 0.677 | -0.005 |
2021-03-31 | 0.097 | 0.694 | -0.004 |
2020-12-31 | 0.111 | 0.701 | 0.001 |
2020-09-30 | 0.130 | 0.705 | 0.056 |
2020-06-30 | 0.157 | 0.619 | 0.068 |
Fortress Transportation & Infrastructure Investors LLC (FTAI) Company Bio
Fortress Transportation and Infrastructure Investors owns and acquires infrastructure and equipment that is essential for the transportation of goods and people globally. The company was founded in 2011 and is based in New York, New York.
Latest FTAI News From Around the Web
Below are the latest news stories about FTAI AVIATION LTD that investors may wish to consider to help them evaluate FTAI as an investment opportunity.
Stealth Picks: 3 Buy-Rated Stocks Flying Below the RadarWhile some stocks are all over the news, these buy-rated stocks offer high returns due to their strong fundamentals. |
What Makes FTAI Aviation Ltd. (FTAI) an Attractive Investment?Tourlite Capital Management, an investment management firm, released its second quarter 2023 investor letter, a copy of which can be downloaded here. Tourlite Fund, LP Founder Class gained -1.2% for Q2 2023 and -0.2% year to date. Since its inception in April 2022, the fund returned 4.9% compared to 0.3% and -7.1% for the S&P 500 […] |
Gabelli Funds to Host 29th Annual Aerospace & Defense Symposium at The Harvard Club, New York, NYRYE, N.Y., Sept. 05, 2023 (GLOBE NEWSWIRE) -- Gabelli Funds, LLC, is hosting our annual Aerospace & Defense Symposium at The Harvard Club in New York, NY on September 7th. The conference will draw 16 companies, with a focus on the themes of the strong demand outlook, high barriers to entry, large aftermarket opportunity, growth in excess of GDP, defense spending, and M&A potential for the Aerospace and Defense industry. Attendees will also have the opportunity to meet with management in a one-on |
This Growth Stock Forms Bullish Pattern After Turning $10,000 To $21,419 In Eight MonthsGrowth stock FTAI has gained 111% in eight months. The stock has formed a bullish three-week tight pattern with a buy point of 36.67 |
Gabelli Funds to Host 29th Annual Aerospace & Defense Symposium at The Harvard Club, New York CityThursday, September 7, 2023RYE, New York, Aug. 09, 2023 (GLOBE NEWSWIRE) -- Gabelli Funds, LLC, is hosting our annual Aerospace & Defense Symposium at The Harvard Club in New York City on September 7th. The conference will draw top executives from more than ten companies, with a focus on the themes of strong demand outlook, high barriers to entry, large aftermarket opportunity, growth in excess of GDP, defense spending, and M&A potential for the Aerospace and Defense industry. Attendees will als |
FTAI Price Returns
1-mo | -5.02% |
3-mo | N/A |
6-mo | 37.42% |
1-year | 152.93% |
3-year | 144.97% |
5-year | 182.34% |
YTD | 114.21% |
2022 | -35.60% |
2021 | 29.27% |
2020 | 33.15% |
2019 | 48.05% |
2018 | -22.18% |
FTAI Dividends
Ex-Dividend Date | Type | Payout Amount | Change | ||||||
---|---|---|---|---|---|---|---|---|---|
Loading, please wait... |
Continue Researching FTAI
Here are a few links from around the web to help you further your research on Fortress Transportation & Infrastructure Investors LLC's stock as an investment opportunity:Fortress Transportation & Infrastructure Investors LLC (FTAI) Stock Price | Nasdaq
Fortress Transportation & Infrastructure Investors LLC (FTAI) Stock Quote, History and News - Yahoo Finance
Fortress Transportation & Infrastructure Investors LLC (FTAI) Stock Price and Basic Information | MarketWatch
Loading social stream, please wait...