TechnipFMC plc Ordinary Share (FTI): Price and Financial Metrics
TechnipFMC plc Ordinary Share (FTI)
Today's Latest Price: $11.28 USD
Updated Jan 27 3:41pm
Add FTI to WatchlistSign Up
POWR Components:
Trade Grade Buy & Hold Grade Peer Grade Industry Rank
Industry Rank:
Ranked of 54 in Energy - Services
See all "A" rated Strong Buy stocks
FTI Stock Summary
- Of note is the ratio of TechnipFMC plc's sales and general administrative expense to its total operating expenses; only 7.53% of US stocks have a lower such ratio.
- FTI's price/sales ratio is 0.36; that's higher than the P/S ratio of only 8.11% of US stocks.
- In terms of twelve month growth in earnings before interest and taxes, TechnipFMC plc is reporting a growth rate of 269.28%; that's higher than 94.66% of US stocks.
- Stocks with similar financial metrics, market capitalization, and price volatility to TechnipFMC plc are CARS, CVEO, HFC, OSW, and NES.
- FTI's SEC filings can be seen here. And to visit TechnipFMC plc's official web site, go to www.technipfmc.com.
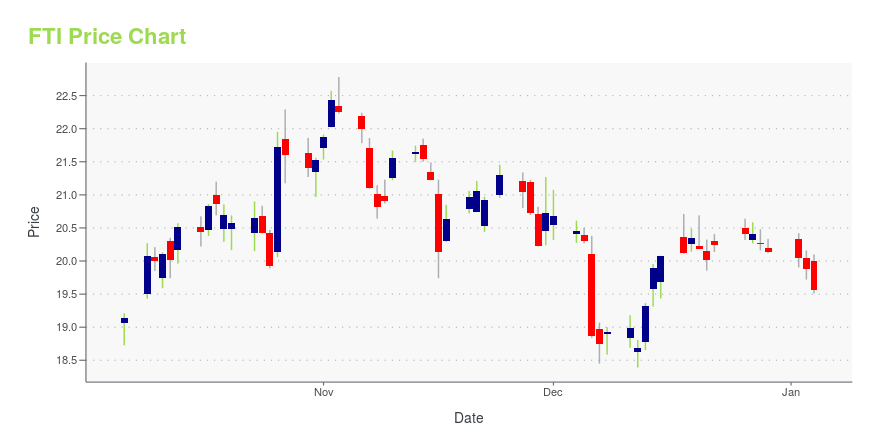
FTI Stock Price Chart Interactive Chart >
FTI Price/Volume Stats
Current price | $11.28 | 52-week high | $18.03 |
Prev. close | $10.69 | 52-week low | $4.49 |
Day low | $10.32 | Volume | 15,271,642 |
Day high | $11.69 | Avg. volume | 8,993,492 |
50-day MA | $9.93 | Dividend yield | N/A |
200-day MA | $8.07 | Market Cap | 5.05B |
TechnipFMC plc Ordinary Share (FTI) Company Bio
TechnipFMC designs, manufactures, and services technological systems and products for customers in the energy industry worldwide. It operates through Subsea Technologies, Surface Technologies, and Energy Infrastructure segments. The company was founded in 2000 and is based in Houston, Texas.
FTI Price Forecast Based on DCF Valuation
Current Price | DCF Fair Value Target: | Forecasted Gain: |
$11.28 | $1.88 | -82% |
We started the process of determining a valid price forecast for TechnipFMC plc with a discounted cash flow analysis -- the results of which can be found in the table below. To summarize, we found that TechnipFMC plc ranked in the 17th percentile in terms of potential gain offered. We should note, though, that all scenearios modelled for this stock suggest it is overvalued. The most interesting components of our discounted cash flow analysis for TechnipFMC plc ended up being:
- 51% of the company's capital comes from equity, which is greater than only 20.83% of stocks in our cash flow based forecasting set.
- TechnipFMC plc's interest coverage rate -- a measure of gross earnings relative to interest payments -- comes in at -10.72. This coverage rate is greater than that of only 7.77% of stocks we're observing for the purpose of forecasting via discounted cash flows.
- As a business, TechnipFMC plc experienced a tax rate of about 0% over the past twelve months; relative to its sector (Energy), this tax rate is higher than just 0% of stocks generating free cash flow.
Terminal Growth Rate in Free Cash Flow | Return Relative to Current Share Price |
0% | -83% |
1% | -83% |
2% | -82% |
3% | -82% |
4% | -82% |
5% | -82% |
For other companies in the Energy that have a similar discounted cashflow valuation profile (and ensuing price forecasts) as FTI, try RDS.A, CHKAQ, HFC, TGA, and PUMP.
Loading social stream, please wait...