H. B. Fuller Company (FUL): Price and Financial Metrics

H. B. Fuller Company (FUL): $68.61

3.04 (-4.24%)

POWR Rating

Component Grades

Momentum

D

Stability

C

Sentiment

Quality

C

Add FUL to Watchlist
Sign Up

Industry: Chemicals

Industry

C

Ranked

#40 of 83

in industry

FUL Price/Volume Stats
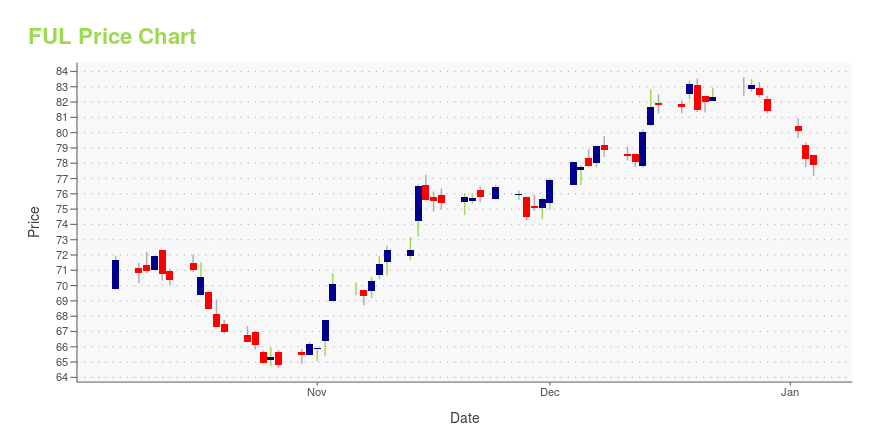
Current price $68.61 52-week high $81.41
Prev. close $71.65 52-week low $60.10
Day low $68.54 Volume 538,600
Day high $72.15 Avg. volume 353,308
50-day MA $70.55 Dividend yield 1.21%
200-day MA $69.08 Market Cap 3.70B

FUL Stock Price Chart Interactive Chart >

FUL POWR Grades

  • FUL scores best on the Value dimension, with a Value rank ahead of 69.34% of US stocks.
  • The strongest trend for FUL is in Quality, which has been heading up over the past 177 days.
  • FUL's current lowest rank is in the Sentiment metric (where it is better than 11.85% of US stocks).

FUL Stock Summary

  • With a one year PEG ratio of 199.47, FULLER H B CO is expected to have a higher PEG ratio (a measure of how expensive a stock is relative to its expected earnings growth) than 86.41% of US stocks.
  • Of note is the ratio of FULLER H B CO's sales and general administrative expense to its total operating expenses; 87.23% of US stocks have a lower such ratio.
  • The volatility of FULLER H B CO's share price is greater than that of merely 4.23% US stocks with at least 200 days of trading history.
  • Stocks that are quantitatively similar to FUL, based on their financial statements, market capitalization, and price volatility, are BBCP, GTES, CROX, BWEN, and SON.
  • FUL's SEC filings can be seen here. And to visit FULLER H B CO's official web site, go to www.hbfuller.com.

FUL Valuation Summary

  • FUL's price/earnings ratio is 24.4; this is 49.24% higher than that of the median Basic Materials stock.
  • Over the past 243 months, FUL's price/sales ratio has gone up 0.5.

Below are key valuation metrics over time for FUL.

Stock Date P/S P/B P/E EV/EBIT
FUL 2023-09-06 1.1 2.3 24.4 16.1
FUL 2023-09-05 1.1 2.3 24.4 16.1
FUL 2023-09-01 1.1 2.3 25.0 16.4
FUL 2023-08-31 1.1 2.3 24.9 16.3
FUL 2023-08-30 1.1 2.3 24.8 16.3
FUL 2023-08-29 1.1 2.3 24.8 16.2

FUL Growth Metrics

    Its 2 year price growth rate is now at 139.42%.
  • Its 5 year revenue growth rate is now at 35.18%.
  • Its year over year net income to common stockholders growth rate is now at 18.31%.
FUL's revenue has moved up $1,625,581,000 over the prior 70 months.

The table below shows FUL's growth in key financial areas (numbers in millions of US dollars).

Date Revenue Operating Cash Flow Net Income to Common Stock
2022-12-31 3,749.183 256.514 180.313
2022-09-30 3,688.394 100.88 182.89
2022-06-30 3,573.994 124.354 168.009
2022-03-31 3,408.609 159.795 169.908
2021-12-31 3,278.031 213.317 161.393
2021-09-30 3,158.247 299.663 151.113

FUL's Quality Factors

The “Quality” component of the POWR Ratings focuses on 31 different factors of a companies fundamentals and operational strength. Here are some key insights as we drill into the specifics of these quality attributes.
  • FUL has a Quality Grade of C, ranking ahead of 41.91% of graded US stocks.
  • FUL's asset turnover comes in at 0.758 -- ranking 33rd of 89 Chemicals stocks.
  • LXU, ECVT, and CGA are the stocks whose asset turnover ratios are most correlated with FUL.

The table below shows FUL's key quality metrics over time.

Period Asset Turnover Gross Margin ROIC
2021-08-28 0.758 0.259 0.095
2021-05-29 0.737 0.268 0.093
2021-02-27 0.712 0.271 0.086
2020-11-28 0.697 0.271 0.078
2020-08-29 0.689 0.270 0.072
2020-05-30 0.695 0.274 0.080

FUL Price Target

For more insight on analysts targets of FUL, see our FUL price target page. And for a list of of all stocks sorted by upside potential based on analyst target price, see our Top Price Target page.

Average Price Target $74.67 Average Broker Recommendation 1.5 (Moderate Buy)

H. B. Fuller Company (FUL) Company Bio


HB Fuller focuses on adhesives, sealants and other specialty chemical products used in packaging, hygiene, general assembly, electronic and assembly materials, paper converting, woodworking, construction, automotive and consumer businesses. The company was founded in 1887 and is based in Saint Paul, Minnesota.


FUL Latest News Stream


Event/Time News Detail
Loading, please wait...

FUL Latest Social Stream


Loading social stream, please wait...

View Full FUL Social Stream

Latest FUL News From Around the Web

Below are the latest news stories about FULLER H B CO that investors may wish to consider to help them evaluate FUL as an investment opportunity.

H.B. Fuller to Report Third Quarter 2023 Results on September 27, 2023

ST. PAUL, Minn., September 13, 2023--H.B. Fuller Company (NYSE: FUL) announced plans to report its financial results for the three-month fiscal period ended September 2, 2023, in a press release issued after the market close on September 27, 2023. The Company will hold an investor conference call on September 28, 2023, at 9:30 a.m. CT (10:30 a.m. ET) to discuss its financial results.

Yahoo | September 13, 2023

Can H.B. Fuller Company (NYSE:FUL) Improve Its Returns?

Many investors are still learning about the various metrics that can be useful when analysing a stock. This article is...

Yahoo | September 13, 2023

Billionaire Stan Druckenmiller’s Small-Cap Stock Picks

In this piece, we will take a look at billionaire Stanley Druckenmiller’s small-cap stock picks. If you want to skip our introduction to Mr. Druckenmiller and small-cap stocks in general, then head on over to Billionaire Stan Druckenmiller’s Small-Cap Stock Picks: Top 5 Stocks. Stanley Druckenmiller is one of the richest people in the world. […]

Yahoo | August 19, 2023

Should You Investigate H.B. Fuller Company (NYSE:FUL) At US$72.14?

H.B. Fuller Company ( NYSE:FUL ), might not be a large cap stock, but it saw a decent share price growth in the teens...

Yahoo | August 11, 2023

3 of the Safest Dividend Kings

Dividend Kings have raised their dividends for a minimum of 50 years.

Bob Ciura on InvestorPlace | August 4, 2023

Read More 'FUL' Stories Here

FUL Price Returns

1-mo -5.40%
3-mo -3.79%
6-mo 2.44%
1-year 15.45%
3-year 55.02%
5-year 38.66%
YTD -3.39%
2022 -10.59%
2021 57.84%
2020 2.15%
2019 22.42%
2018 -19.84%

FUL Dividends

Ex-Dividend Date Type Payout Amount Change
Loading, please wait...
View Full FUL Dividend History

Get Free Updates

Join thousands of investors who get the latest news, insights and top rated picks from StockNews.com!