Fulton Financial Corporation (FULT): Price and Financial Metrics
GET POWR RATINGS... FREE!
FULT POWR Grades
- Growth is the dimension where FULT ranks best; there it ranks ahead of 84.99% of US stocks.
- FULT's strongest trending metric is Growth; it's been moving up over the last 177 days.
- FULT ranks lowest in Sentiment; there it ranks in the 4th percentile.
FULT Stock Summary
- FULT's one year PEG ratio, measuring expected growth in earnings next year relative to current common stock price is 161.26 -- higher than 85.35% of US-listed equities with positive expected earnings growth.
- FULT's went public 32.86 years ago, making it older than 85.87% of listed US stocks we're tracking.
- Equity multiplier, or assets relative to shareholders' equity, comes in at 10.05 for FULTON FINANCIAL CORP; that's greater than it is for 90.89% of US stocks.
- If you're looking for stocks that are quantitatively similar to FULTON FINANCIAL CORP, a group of peers worth examining would be MBCN, SYBT, CHCO, WABC, and CFFI.
- FULT's SEC filings can be seen here. And to visit FULTON FINANCIAL CORP's official web site, go to www.fult.com.
FULT Valuation Summary
- In comparison to the median Financial Services stock, FULT's EV/EBIT ratio is 2.7% lower, now standing at 10.8.
- Over the past 243 months, FULT's EV/EBIT ratio has gone down 2.
Below are key valuation metrics over time for FULT.
Stock | Date | P/S | P/B | P/E | EV/EBIT |
---|---|---|---|---|---|
FULT | 2023-01-23 | 2.8 | 1.1 | 10.4 | 10.8 |
FULT | 2023-01-20 | 2.8 | 1.1 | 10.2 | 10.6 |
FULT | 2023-01-19 | 2.7 | 1.0 | 10.1 | 10.5 |
FULT | 2023-01-18 | 2.7 | 1.0 | 9.9 | 10.4 |
FULT | 2023-01-17 | 2.9 | 1.1 | 10.8 | 11.1 |
FULT | 2023-01-13 | 3.0 | 1.1 | 11.0 | 11.3 |
FULT Growth Metrics
- Its 4 year revenue growth rate is now at 12.96%.
- The 5 year revenue growth rate now stands at 12.96%.
- Its 2 year net cashflow from operations growth rate is now at -26.98%.

The table below shows FULT's growth in key financial areas (numbers in millions of US dollars).
Date | Revenue | Operating Cash Flow | Net Income to Common Stock |
---|---|---|---|
2022-09-30 | 949.517 | 539.319 | 256.786 |
2022-06-30 | 928.178 | 93.001 | 261.498 |
2022-03-31 | 910.245 | 31.079 | 256.473 |
2021-12-31 | 952.075 | 342.272 | 265.22 |
2021-09-30 | 928.506 | 447.166 | 254.587 |
2021-06-30 | 904.343 | 423.412 | 243.173 |
FULT's Quality Factors
The “Quality” component of the POWR Ratings focuses on 31 different factors of a companies fundamentals and operational strength. Here are some key insights as we drill into the specifics of these quality attributes.- FULT has a Quality Grade of C, ranking ahead of 38.66% of graded US stocks.
- FULT's asset turnover comes in at 0.035 -- ranking 280th of 428 Banking stocks.
- PEBO, SMBK, and BY are the stocks whose asset turnover ratios are most correlated with FULT.
The table below shows FULT's key quality metrics over time.
Period | Asset Turnover | Gross Margin | ROIC |
---|---|---|---|
2021-06-30 | 0.035 | 1 | 0.012 |
2021-03-31 | 0.034 | 1 | 0.010 |
2020-12-31 | 0.032 | 1 | 0.008 |
2020-09-30 | 0.032 | 1 | 0.008 |
2020-06-30 | 0.034 | 1 | 0.009 |
2020-03-31 | 0.036 | 1 | 0.010 |
FULT Price Target
For more insight on analysts targets of FULT, see our FULT price target page. And for a list of of all stocks sorted by upside potential based on analyst target price, see our Top Price Target page.
Average Price Target | $16.50 | Average Broker Recommendation | 2 (Hold) |
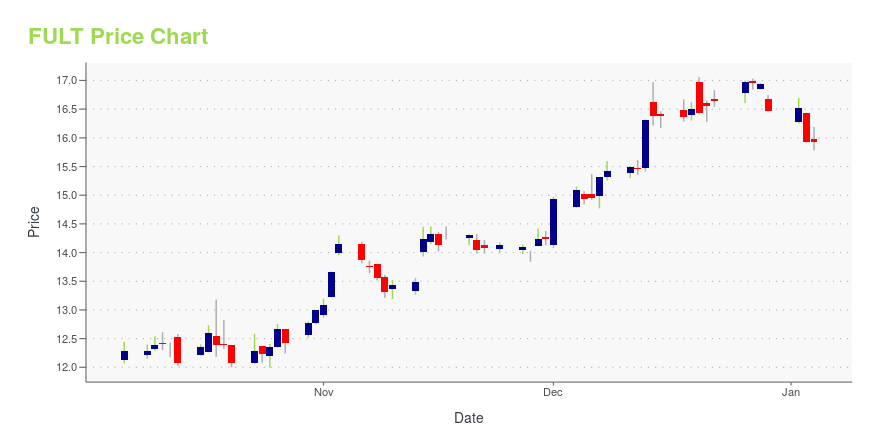
FULT Stock Price Chart Interactive Chart >
FULT Price/Volume Stats
Current price | $16.20 | 52-week high | $18.91 |
Prev. close | $16.18 | 52-week low | $13.72 |
Day low | $16.08 | Volume | 223,227 |
Day high | $16.31 | Avg. volume | 1,076,368 |
50-day MA | $17.07 | Dividend yield | 3.71% |
200-day MA | $16.38 | Market Cap | 2.71B |
Fulton Financial Corporation (FULT) Company Bio
Fulton Financial provides a range of banking and financial services to businesses and consumers in Pennsylvania, Maryland, Delaware, New Jersey, and Virginia. The company was founded in 1882 and is based in Lancaster, Pennsylvania.
Latest FULT News From Around the Web
Below are the latest news stories about FULTON FINANCIAL CORP that investors may wish to consider to help them evaluate FULT as an investment opportunity.
Operation HOPE and Fulton Bank Partnership Generates Nearly $1 Billion in Loans to Low- and Moderate-Income HomebuyersLANCASTER, Pa. & ATLANTA, January 23, 2023--Operation HOPE recognized Fulton Bank for providing nearly $1 billion in loans to low- and moderate-income homebuyers over the past seven years. |
Fulton Financial Corporation (NASDAQ:FULT) Q4 2022 Earnings Call TranscriptFulton Financial Corporation (NASDAQ:FULT) Q4 2022 Earnings Call Transcript January 18, 2023 Operator: Good day, and thank you for standing by. Welcome to the Fulton Financial Fourth Quarter 2022 Results Conference Call. At this time, all participants are in a listen-only mode. After the speakers’ presentation, there’ll be a question-and-answer session. Please be advised that […] |
Fulton Financial (FULT) Q4 Earnings and Revenues Lag EstimatesFulton Financial (FULT) delivered earnings and revenue surprises of -4% and 0.29%, respectively, for the quarter ended December 2022. Do the numbers hold clues to what lies ahead for the stock? |
Fulton Financial Corporation Announces Fourth Quarter and 2022 ResultsLANCASTER, Pa., January 17, 2023--Fulton Financial Corporation (NASDAQ:FULT) ("Fulton" or the "Corporation") reported net income available to common shareholders of $79.3 million, or $0.47 per diluted share, for the fourth quarter of 2022, an increase of $11.0 million, or 16.0%, in comparison to the third quarter of 2022. The Corporation reported net income available to common shareholders of $276.7 million, or $1.67 per diluted share, for the year ended December 31, 2022, an increase of $11.5 m |
Fulton Financial (FULT) Earnings Expected to Grow: What to Know Ahead of Next Week's ReleaseFulton Financial (FULT) doesn't possess the right combination of the two key ingredients for a likely earnings beat in its upcoming report. Get prepared with the key expectations. |
FULT Price Returns
1-mo | -3.74% |
3-mo | -10.15% |
6-mo | 0.87% |
1-year | -6.27% |
3-year | 12.13% |
5-year | 8.34% |
YTD | -3.74% |
2022 | 3.11% |
2021 | 38.96% |
2020 | -23.17% |
2019 | 16.51% |
2018 | -10.77% |
FULT Dividends
Ex-Dividend Date | Type | Payout Amount | Change | ||||||
---|---|---|---|---|---|---|---|---|---|
Loading, please wait... |
Continue Researching FULT
Want to do more research on Fulton Financial Corp's stock and its price? Try the links below:Fulton Financial Corp (FULT) Stock Price | Nasdaq
Fulton Financial Corp (FULT) Stock Quote, History and News - Yahoo Finance
Fulton Financial Corp (FULT) Stock Price and Basic Information | MarketWatch
Loading social stream, please wait...