
Golub Capital BDC, Inc. (GBDC): Price and Financial Metrics
GBDC Price/Volume Stats
| Current price | $15.45 | 52-week high | $17.72 |
| Prev. close | $15.40 | 52-week low | $13.78 |
| Day low | $15.37 | Volume | 1,512,000 |
| Day high | $15.48 | Avg. volume | 1,024,561 |
| 50-day MA | $15.89 | Dividend yield | 10.04% |
| 200-day MA | $15.63 | Market Cap | 2.65B |
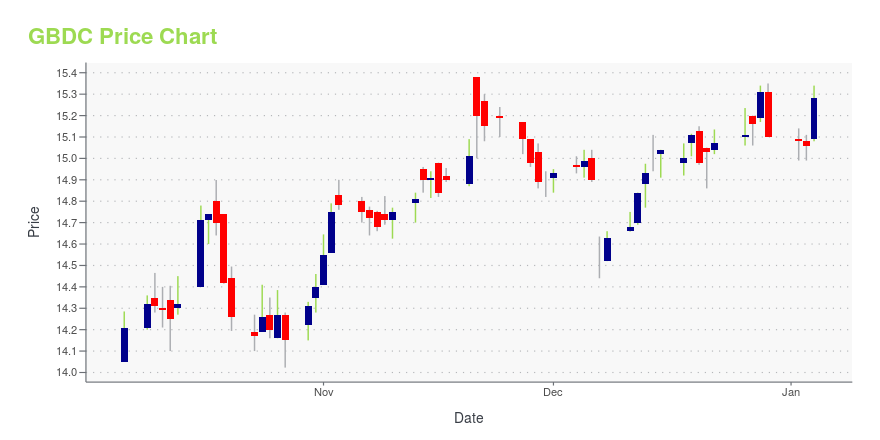
GBDC Stock Price Chart Interactive Chart >
Golub Capital BDC, Inc. (GBDC) Company Bio
Golub Capital BDC, Inc. is a business development company and operates as an externally managed closed-end non-diversified management investment company. It invests in debt and minority equity investments in middle-market companies that are, in most cases, sponsored by private equity investors. The company seeks to invest in the United States. It primarily invests in senior secured, one stop, unitranche, second lien, subordinated and mezzanine loans of middle-market companies, and warrants. The company was founded in 1994 and is based in New York City, New York.
Latest GBDC News From Around the Web
Below are the latest news stories about GOLUB CAPITAL BDC INC that investors may wish to consider to help them evaluate GBDC as an investment opportunity.
Zacks Industry Outlook Highlights Ares Capital, Golub Capital BDC and BlackRock TCP CapitalAres Capital, Golub Capital BDC and BlackRock TCP Capital are part of the Zacks Industry Outlook article. |
3 SBIC & Commercial Finance Stocks From a Thriving IndustryHigh interest rates, decent demand for personalized finance, solid asset quality and regulatory changes are likely to keep aiding the Zacks SBIC & Commercial Finance industry players like Ares Capital (ARCC), Golub Capital (GBDC) and BlackRock TCP (TCPC). |
Strength Seen in PhenixFIN (PFX): Can Its 5.1% Jump Turn into More Strength?PhenixFIN (PFX) saw its shares surge in the last session with trading volume being higher than average. The latest trend in earnings estimate revisions may not translate into further price increase in the near term. |
Golub Capital President Keeps Lender in FocusDavid Golub recently discussed trends driving private-credit growth and how tax changes could revive deal flow. |
Golub Capital BDC, Inc. Prices Public Offering of $450 Million 7.050% Notes Due 2028Golub Capital BDC, Inc. (the "Company," "we," "us" or "our"), a business development company (Nasdaq: GBDC), announced that it has priced an underwritten public offering of $450 million in aggregate principal amount of 7.050% notes due 2028. The notes will mature on December 5, 2028 and may be redeemed in whole or in part at the Company's option at any time prior to November 5, 2028, at par plus a "make-whole" premium, and thereafter at par. |
GBDC Price Returns
| 1-mo | -2.09% |
| 3-mo | -8.55% |
| 6-mo | 5.65% |
| 1-year | 24.29% |
| 3-year | 29.23% |
| 5-year | 33.66% |
| YTD | 8.52% |
| 2023 | 27.69% |
| 2022 | -6.99% |
| 2021 | 17.78% |
| 2020 | -16.50% |
| 2019 | 21.12% |
GBDC Dividends
| Ex-Dividend Date | Type | Payout Amount | Change | ||||||
|---|---|---|---|---|---|---|---|---|---|
| Loading, please wait... | |||||||||
Continue Researching GBDC
Want to do more research on GOLUB CAPITAL BDC Inc's stock and its price? Try the links below:GOLUB CAPITAL BDC Inc (GBDC) Stock Price | Nasdaq
GOLUB CAPITAL BDC Inc (GBDC) Stock Quote, History and News - Yahoo Finance
GOLUB CAPITAL BDC Inc (GBDC) Stock Price and Basic Information | MarketWatch
Loading social stream, please wait...