General Dynamics Corporation (GD): Price and Financial Metrics
GD Price/Volume Stats
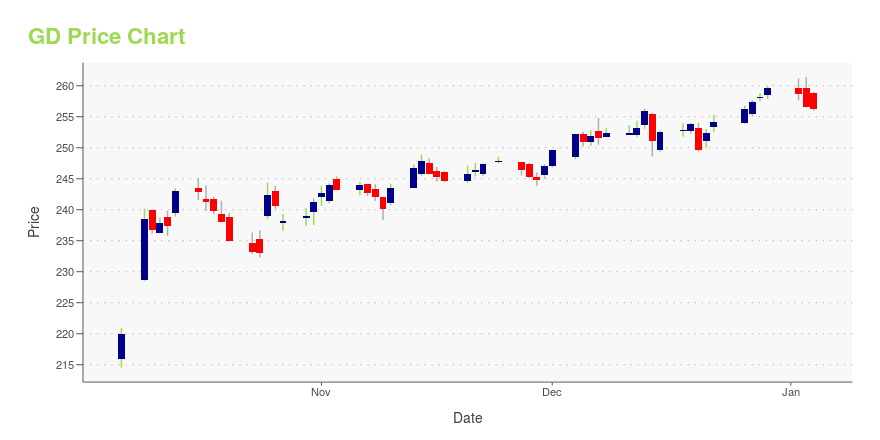
Current price | $277.60 | 52-week high | $277.72 |
Prev. close | $275.21 | 52-week low | $202.35 |
Day low | $274.67 | Volume | 865,300 |
Day high | $277.72 | Avg. volume | 1,096,632 |
50-day MA | $265.93 | Dividend yield | 1.92% |
200-day MA | $239.22 | Market Cap | 76.06B |
GD Stock Price Chart Interactive Chart >
GD POWR Grades
- GD scores best on the Momentum dimension, with a Momentum rank ahead of 81.12% of US stocks.
- GD's strongest trending metric is Value; it's been moving down over the last 26 weeks.
- GD ranks lowest in Growth; there it ranks in the 47th percentile.
GD Stock Summary
- GD has a higher market value than 96.4% of US stocks; more precisely, its current market capitalization is $70,008,960,464.
- GENERAL DYNAMICS CORP's stock had its IPO on January 1, 1986, making it an older stock than 92.92% of US equities in our set.
- Of note is the ratio of GENERAL DYNAMICS CORP's sales and general administrative expense to its total operating expenses; 87.34% of US stocks have a lower such ratio.
- If you're looking for stocks that are quantitatively similar to GENERAL DYNAMICS CORP, a group of peers worth examining would be MKTX, ELV, WAT, EVRI, and GTX.
- To dig deeper into the stock's financial statements, go to GD's page on browse-edgar?action=getcompany&CIK=0000040533.
GD Valuation Summary
- GD's price/sales ratio is 1.7; this is 19.05% lower than that of the median Industrials stock.
- Over the past 243 months, GD's price/earnings ratio has gone up 1.5.
Below are key valuation metrics over time for GD.
Stock | Date | P/S | P/B | P/E | EV/EBIT |
---|---|---|---|---|---|
GD | 2023-12-29 | 1.7 | 3.6 | 21.5 | 18.2 |
GD | 2023-12-28 | 1.7 | 3.5 | 21.3 | 18.1 |
GD | 2023-12-27 | 1.7 | 3.5 | 21.3 | 18.1 |
GD | 2023-12-26 | 1.7 | 3.5 | 21.2 | 18.0 |
GD | 2023-12-22 | 1.7 | 3.5 | 21.0 | 17.9 |
GD | 2023-12-21 | 1.7 | 3.5 | 20.9 | 17.8 |
GD Growth Metrics
- The 2 year price growth rate now stands at 75.62%.
- Its 3 year revenue growth rate is now at 1.46%.
- Its 4 year cash and equivalents growth rate is now at 145.85%.
The table below shows GD's growth in key financial areas (numbers in millions of US dollars).
Date | Revenue | Operating Cash Flow | Net Income to Common Stock |
---|---|---|---|
2022-09-30 | 38,848 | 5,592 | 3,350 |
2022-06-30 | 38,441 | 5,780 | 3,308 |
2022-03-31 | 38,472 | 6,236 | 3,279 |
2021-12-31 | 38,469 | 4,271 | 3,257 |
2021-09-30 | 38,658 | 5,151 | 3,307 |
2021-06-30 | 38,521 | 4,799 | 3,281 |
GD's Quality Factors
The “Quality” component of the POWR Ratings focuses on 31 different factors of a companies fundamentals and operational strength. Here are some key insights as we drill into the specifics of these quality attributes.- GD has a Quality Grade of C, ranking ahead of 69.1% of graded US stocks.
- GD's asset turnover comes in at 0.759 -- ranking 7th of 10 Shipbuilding Railroad Equipment stocks.
- RAIL, TRN, and WAB are the stocks whose asset turnover ratios are most correlated with GD.
The table below shows GD's key quality metrics over time.
Period | Asset Turnover | Gross Margin | ROIC |
---|---|---|---|
2021-10-03 | 0.759 | 0.167 | 0.178 |
2021-07-04 | 0.760 | 0.167 | 0.180 |
2021-04-04 | 0.765 | 0.164 | 0.177 |
2020-12-31 | 0.738 | 0.167 | 0.173 |
2020-09-27 | 0.753 | 0.169 | 0.178 |
2020-06-28 | 0.765 | 0.172 | 0.188 |
GD Price Target
For more insight on analysts targets of GD, see our GD price target page. And for a list of of all stocks sorted by upside potential based on analyst target price, see our Top Price Target page.
Average Price Target | $215.56 | Average Broker Recommendation | 1.69 (Moderate Buy) |
General Dynamics Corporation (GD) Company Bio
General Dynamics operates as aerospace and defense company worldwide. It operates through four business groups: Aerospace; Combat Systems; Information Systems and Technology; and Marine Systems. The company was founded in 1899 and is based in Falls Church, Virginia.
Latest GD News From Around the Web
Below are the latest news stories about GENERAL DYNAMICS CORP that investors may wish to consider to help them evaluate GD as an investment opportunity.
Stocks, sectors that reached record highs in 20232023 — and the month of December — has been a year for record gains across various sectors and stocks, such as homebuilders and tech companies. Yahoo Finance's Jared Blikre highlights several stocks and industries that have reached new highs year-to-date. For more expert insight and the latest market action, click here to watch this full episode of Yahoo Finance Live. |
General Dynamics (GD) Outpaces Stock Market Gains: What You Should KnowIn the latest trading session, General Dynamics (GD) closed at $257.43, marking a +0.48% move from the previous day. |
General Dynamics' (GD) Unit Wins $1.3B Canada Army ContractsGeneral Dynamics' (GD) unit General Dynamics Mission Systems' long-standing relationship with Canada's Army will help expand its footprint in the C4ISR market. |
General Dynamics Mission Systems-Canada Awarded four Land C4ISR Contracts for the Canadian Army valued at up to CA$1.7 BillionGeneral Dynamics Mission Systems–Canada announced today that it was awarded four contracts cumulatively valued at up to CA$1.68 billion (US$1.3 billion) by the Government of Canada to support the Land Command, Control, Communications, Computers, Intelligence, Surveillance and Reconnaissance (C4ISR) system for the Canadian Army. |
14 Most Profitable Industrial Stocks NowIn this piece, we will take a look at the 14 most profitable industrial stocks to buy now. If you want to skip our overview of the industrial sector and some recent developments, then take a look at 5 Most Profitable Industrial Stocks Now. The industrial sector plays a fundamental role in the U.S. economy, […] |
GD Price Returns
1-mo | 3.03% |
3-mo | 11.83% |
6-mo | 26.54% |
1-year | 29.20% |
3-year | 67.55% |
5-year | 84.87% |
YTD | 7.47% |
2023 | 7.13% |
2022 | 21.69% |
2021 | 43.78% |
2020 | -13.14% |
2019 | 14.80% |
GD Dividends
Ex-Dividend Date | Type | Payout Amount | Change | ||||||
---|---|---|---|---|---|---|---|---|---|
Loading, please wait... |
Continue Researching GD
Want to see what other sources are saying about General Dynamics Corp's financials and stock price? Try the links below:General Dynamics Corp (GD) Stock Price | Nasdaq
General Dynamics Corp (GD) Stock Quote, History and News - Yahoo Finance
General Dynamics Corp (GD) Stock Price and Basic Information | MarketWatch
Loading social stream, please wait...