
General Electric Co. (GE): Price and Financial Metrics
GE Price/Volume Stats
| Current price | $169.81 | 52-week high | $177.20 |
| Prev. close | $164.67 | 52-week low | $84.42 |
| Day low | $166.11 | Volume | 7,297,386 |
| Day high | $172.62 | Avg. volume | 7,165,609 |
| 50-day MA | $162.14 | Dividend yield | 0.65% |
| 200-day MA | $128.38 | Market Cap | 185.88B |
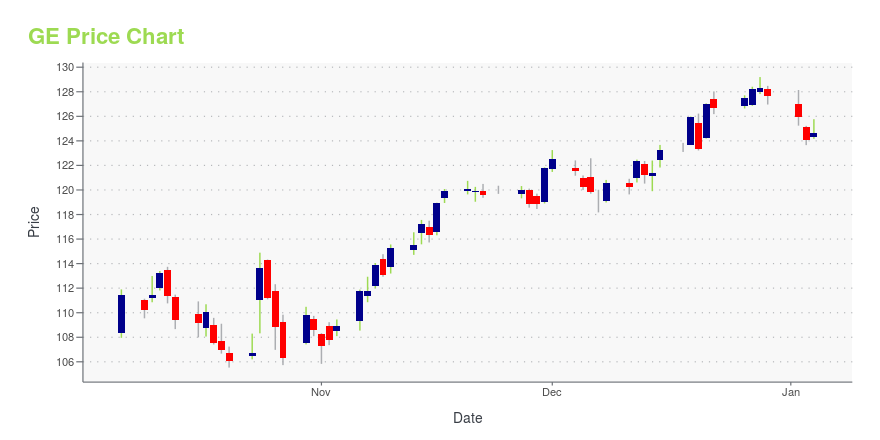
GE Stock Price Chart Interactive Chart >
General Electric Co. (GE) Company Bio
General Electric Co. is an American multinational conglomerate, founded in 1892 in Schenectady, New York. General Electric is best known for its work in the Power, Renewable Energy, Aviation and Healthcare industries. Headquartered in Boston, MA, General Electric has operations in over 180 countries and employs over 170,000 people worldwide. In 2020, Fortune 500 ranked GE as the 33rd largest firm in the United States by gross revenue.
Latest GE News From Around the Web
Below are the latest news stories about GENERAL ELECTRIC CO that investors may wish to consider to help them evaluate GE as an investment opportunity.
Top 3 Industrial Stock Picks for the New YearThe industrial economy is set to rebound in the coming months, lining up with these industrial stock picks will put the odds in your favor. |
Top Research Reports for Visa, Adobe & TotalEnergiesToday's Research Daily features new research reports on 16 major stocks, including Visa Inc. (V), Adobe Inc. (ADBE) and TotalEnergies SE (TTE). |
With 76% institutional ownership, General Electric Company (NYSE:GE) is a favorite amongst the big gunsKey Insights Significantly high institutional ownership implies General Electric's stock price is sensitive to their... |
25 Richest U.S. Cities by GDP Per CapitaIn this piece, we will take a look at the 25 richest U.S. cities by GDP per capita. For more rich U.S. cities, head on over to the 5 Richest U.S. Cities by GDP Per Capita. The United States has been well-renowned as the land of opportunities for decades. The economic prowess and entrepreneurial spirit […] |
Top 10 Geothermal Energy Companies in the USIn this article, we will see the top 10 geothermal energy companies in the US. If you want to skip our detailed analysis of the geothermal energies market, you can go directly to the Top 5 Geothermal Energy Companies in the US. Geothermal energy is a renewable, reliable, and clean energy source, produced from the […] |
GE Price Returns
| 1-mo | 5.89% |
| 3-mo | 4.77% |
| 6-mo | 62.36% |
| 1-year | 84.79% |
| 3-year | 164.44% |
| 5-year | 233.70% |
| YTD | 66.89% |
| 2023 | 96.71% |
| 2022 | -10.92% |
| 2021 | 10.27% |
| 2020 | -2.73% |
| 2019 | 48.02% |
GE Dividends
| Ex-Dividend Date | Type | Payout Amount | Change | ||||||
|---|---|---|---|---|---|---|---|---|---|
| Loading, please wait... | |||||||||
Continue Researching GE
Here are a few links from around the web to help you further your research on General Electric Co's stock as an investment opportunity:General Electric Co (GE) Stock Price | Nasdaq
General Electric Co (GE) Stock Quote, History and News - Yahoo Finance
General Electric Co (GE) Stock Price and Basic Information | MarketWatch
Loading social stream, please wait...