Geo Group Inc (The) REIT (GEO): Price and Financial Metrics
GET POWR RATINGS... FREE!
GEO POWR Grades
- Value is the dimension where GEO ranks best; there it ranks ahead of 89.22% of US stocks.
- GEO's strongest trending metric is Momentum; it's been moving up over the last 179 days.
- GEO ranks lowest in Growth; there it ranks in the 30th percentile.
GEO Stock Summary
- Price to trailing twelve month operating cash flow for GEO is currently 2.63, higher than only 8.09% of US stocks with positive operating cash flow.
- For GEO, its debt to operating expenses ratio is greater than that reported by 89.79% of US equities we're observing.
- GEO's price/sales ratio is 0.33; that's higher than the P/S ratio of merely 6.27% of US stocks.
- Stocks that are quantitatively similar to GEO, based on their financial statements, market capitalization, and price volatility, are WEN, SPH, BUR, SIX, and PLYA.
- Visit GEO's SEC page to see the company's official filings. To visit the company's web site, go to www.geogroup.com.
GEO Valuation Summary
- GEO's price/sales ratio is 0.4; this is 93.85% lower than that of the median Real Estate stock.
- GEO's price/earnings ratio has moved down 11.3 over the prior 243 months.
- GEO's price/sales ratio has moved down 0.1 over the prior 243 months.
Below are key valuation metrics over time for GEO.
Stock | Date | P/S | P/B | P/E | EV/EBIT |
---|---|---|---|---|---|
GEO | 2021-09-02 | 0.4 | 1.0 | 6.8 | 12.0 |
GEO | 2021-09-01 | 0.4 | 1.0 | 6.7 | 12.0 |
GEO | 2021-08-31 | 0.4 | 1.0 | 6.6 | 11.9 |
GEO | 2021-08-30 | 0.4 | 0.9 | 6.5 | 11.9 |
GEO | 2021-08-27 | 0.4 | 1.0 | 6.5 | 11.9 |
GEO | 2021-08-26 | 0.4 | 0.9 | 6.5 | 11.9 |
GEO Growth Metrics
- Its 5 year net income to common stockholders growth rate is now at 5.64%.
- Its year over year price growth rate is now at -46.52%.
- Its year over year cash and equivalents growth rate is now at 309.63%.

The table below shows GEO's growth in key financial areas (numbers in millions of US dollars).
Date | Revenue | Operating Cash Flow | Net Income to Common Stock |
---|---|---|---|
2021-12-31 | 2,256.612 | 282.635 | 77.418 |
2021-09-30 | 2,277.189 | 373.083 | 139.124 |
2021-06-30 | 2,299.048 | 390.518 | 143.634 |
2021-03-31 | 2,321.458 | 438.391 | 138.395 |
2020-12-31 | 2,350.098 | 441.733 | 113.032 |
2020-09-30 | 2,393.692 | 373.312 | 139.173 |
GEO's Quality Factors
The “Quality” component of the POWR Ratings focuses on 31 different factors of a companies fundamentals and operational strength. Here are some key insights as we drill into the specifics of these quality attributes.- GEO has a Quality Grade of C, ranking ahead of 47.67% of graded US stocks.
- GEO's asset turnover comes in at 0.52 -- ranking 39th of 444 Trading stocks.
- MN, EARN, and VICI are the stocks whose asset turnover ratios are most correlated with GEO.
The table below shows GEO's key quality metrics over time.
Period | Asset Turnover | Gross Margin | ROIC |
---|---|---|---|
2021-06-30 | 0.520 | 0.258 | 0.051 |
2021-03-31 | 0.534 | 0.248 | 0.050 |
2020-12-31 | 0.548 | 0.243 | 0.046 |
2020-09-30 | 0.563 | 0.240 | 0.051 |
2020-06-30 | 0.575 | 0.241 | 0.054 |
2020-03-31 | 0.578 | 0.246 | 0.056 |
GEO Price Target
For more insight on analysts targets of GEO, see our GEO price target page. And for a list of of all stocks sorted by upside potential based on analyst target price, see our Top Price Target page.
Average Price Target | $12.75 | Average Broker Recommendation | 1.75 (Moderate Buy) |
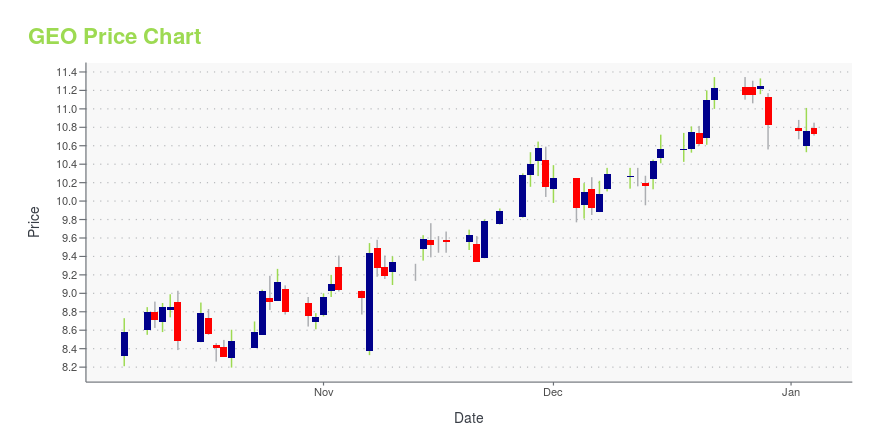
GEO Stock Price Chart Interactive Chart >
GEO Price/Volume Stats
Current price | $6.87 | 52-week high | $9.81 |
Prev. close | $6.74 | 52-week low | $5.20 |
Day low | $6.75 | Volume | 692,900 |
Day high | $6.95 | Avg. volume | 1,972,126 |
50-day MA | $6.64 | Dividend yield | N/A |
200-day MA | $6.98 | Market Cap | 852.50M |
Geo Group Inc (The) REIT (GEO) Company Bio
The Geo Group specializes in the ownership, leasing and management of correctional, detention and re-entry facilities and the provision of community-based services and youth services in the United States, Australia, South Africa and the United Kingdom. The company was founded in 1984 and is based in Boca Raton, Florida.
Latest GEO News From Around the Web
Below are the latest news stories about Geo Group Inc that investors may wish to consider to help them evaluate GEO as an investment opportunity.
GEO Group Stock: Tactically Covering Short PositionNo summary available. |
GEO Group Q4 results reflect growth in operating income as expenses tightenGEO Group (NYSE:GEO) fourth-quarter earnings on Thursday came in above consensus, as operating income was strengthened by a decline in expenses. Note the company incurred a non-cash deferred tax charge of $70.8M in Q4 following its previously announced corporate tax restructuring from a real estate investment trust to a taxable C... |
GEO Group Clocks 3.6% Revenue Decline In Q4GEO Group Inc (NYSE: GEO ) reported a fourth-quarter revenue decline of 3.6% year-over-year to $557.54 million, missing the consensus of $558.09 million. The operating income increased by 73.9% Y/Y to $76.02 million, and the margin expanded by 608 bps to 13.6%. Adjusted EPS improved to $0.38 … Full story available on Benzinga.com |
GEO Group FFO of $0.52 beats by $0.17, revenue of $557.54M in-lineGEO Group press release (GEO): Q4 FFO of $0.52 beats by $0.17 |
The Geo Group (GEO) Q4 2021 Earnings Call TranscriptGEO earnings call for the period ending December 31, 2021. |
GEO Price Returns
1-mo | 6.51% |
3-mo | 8.53% |
6-mo | 5.21% |
1-year | -18.02% |
3-year | -52.34% |
5-year | -63.73% |
YTD | -11.35% |
2021 | -9.92% |
2020 | -39.13% |
2019 | -6.80% |
2018 | -9.35% |
2017 | 5.08% |
Continue Researching GEO
Want to do more research on Geo Group Inc's stock and its price? Try the links below:Geo Group Inc (GEO) Stock Price | Nasdaq
Geo Group Inc (GEO) Stock Quote, History and News - Yahoo Finance
Geo Group Inc (GEO) Stock Price and Basic Information | MarketWatch
Loading social stream, please wait...