Graco Inc. (GGG): Price and Financial Metrics
GGG Price/Volume Stats
Current price | $88.13 | 52-week high | $94.77 |
Prev. close | $88.09 | 52-week low | $68.78 |
Day low | $88.13 | Volume | 18,796 |
Day high | $88.80 | Avg. volume | 643,751 |
50-day MA | $91.08 | Dividend yield | 1.15% |
200-day MA | $82.61 | Market Cap | 14.85B |
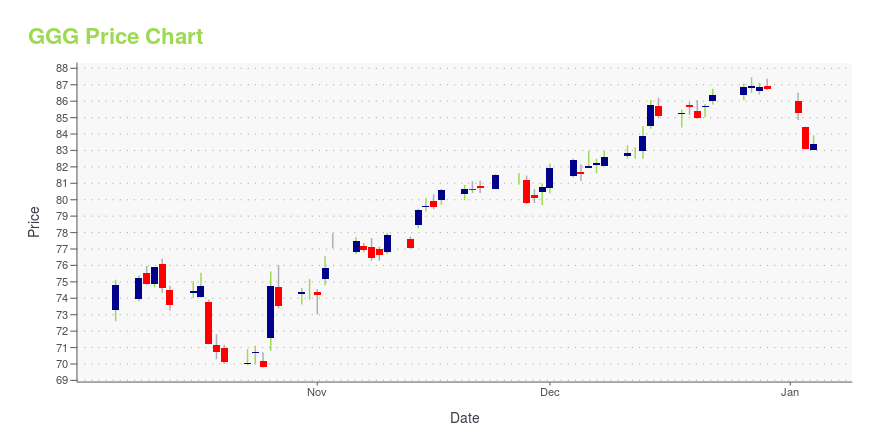
GGG Stock Price Chart Interactive Chart >
Graco Inc. (GGG) Company Bio
Graco is an American manufacturer of fluid-handling systems and products based in Minneapolis, Minnesota. (Source:Wikipedia)
Latest GGG News From Around the Web
Below are the latest news stories about GRACO INC that investors may wish to consider to help them evaluate GGG as an investment opportunity.
Hidden High-Yielders: 3 Lesser-Known Stocks With Attractive DividendsOne of the best ways for investors to generate income and protect their portfolios in 2024 is with high-yield dividend stocks. |
Investors in Graco (NYSE:GGG) have seen splendid returns of 122% over the past five yearsThe worst result, after buying shares in a company (assuming no leverage), would be if you lose all the money you put... |
Why This 1 Growth Stock Could Be a Great Addition to Your PortfolioWhether you're a value, growth, or momentum investor, finding strong stocks becomes easier with the Zacks Style Scores, a top feature of the Zacks Premium research service. |
3 Overlooked Industrial Stocks Set to Skyrocket in the Next DecadeNavigate the world of overlooked industrial stocks and learn how these undervalued stocks could be the key to diversifying your portfolio. |
Graco Publishes Environmental, Social and Governance (ESG) ReportMINNEAPOLIS, December 07, 2023--Graco Inc. (NYSE:GGG), a leading manufacturer of fluid handling equipment, released today its 2022 environmental, social and governance (ESG) report. This report provides not only an update to the inaugural 2021 report, but now also includes the Sustainability Accounting Standards Board (SASB) index for Industrial Machinery and Goods, as well as global energy and emissions data. |
GGG Price Returns
1-mo | -5.19% |
3-mo | 3.97% |
6-mo | 26.40% |
1-year | 26.26% |
3-year | 20.24% |
5-year | 76.02% |
YTD | 2.17% |
2023 | 30.62% |
2022 | -15.48% |
2021 | 12.57% |
2020 | 40.97% |
2019 | 25.94% |
GGG Dividends
Ex-Dividend Date | Type | Payout Amount | Change | ||||||
---|---|---|---|---|---|---|---|---|---|
Loading, please wait... |
Continue Researching GGG
Here are a few links from around the web to help you further your research on Graco Inc's stock as an investment opportunity:Graco Inc (GGG) Stock Price | Nasdaq
Graco Inc (GGG) Stock Quote, History and News - Yahoo Finance
Graco Inc (GGG) Stock Price and Basic Information | MarketWatch
Loading social stream, please wait...