Graco Inc. (GGG): Price and Financial Metrics
GGG Price/Volume Stats
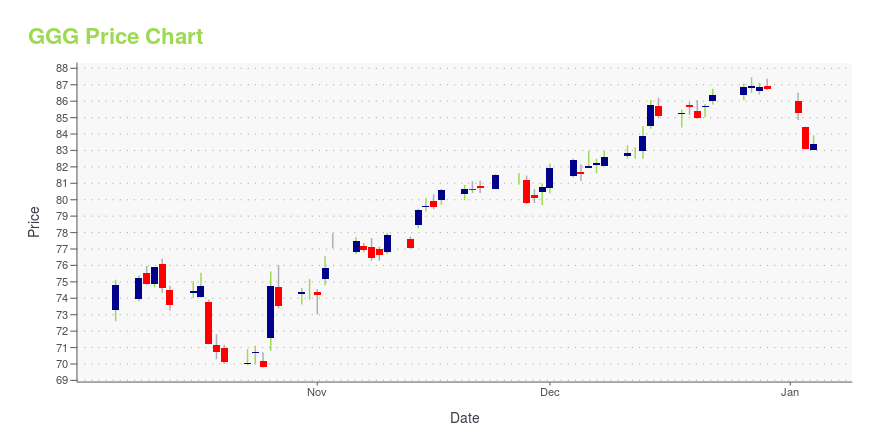
Current price | $81.96 | 52-week high | $87.94 |
Prev. close | $80.78 | 52-week low | $65.23 |
Day low | $80.38 | Volume | 633,100 |
Day high | $82.20 | Avg. volume | 829,314 |
50-day MA | $75.70 | Dividend yield | 1.16% |
200-day MA | $76.52 | Market Cap | 13.83B |
GGG Stock Price Chart Interactive Chart >
GGG POWR Grades
- Quality is the dimension where GGG ranks best; there it ranks ahead of 93.81% of US stocks.
- The strongest trend for GGG is in Stability, which has been heading up over the past 177 days.
- GGG's current lowest rank is in the Value metric (where it is better than 13.86% of US stocks).
GGG Stock Summary
- With a market capitalization of $13,143,527,634, GRACO INC has a greater market value than 86.93% of US stocks.
- GRACO INC's stock had its IPO on July 9, 1986, making it an older stock than 92.59% of US equities in our set.
- With a year-over-year growth in debt of -65.64%, GRACO INC's debt growth rate surpasses only 3.33% of about US stocks.
- Stocks that are quantitatively similar to GGG, based on their financial statements, market capitalization, and price volatility, are FTV, LNN, CW, ITT, and TFX.
- GGG's SEC filings can be seen here. And to visit GRACO INC's official web site, go to www.graco.com.
GGG Valuation Summary
- GGG's price/earnings ratio is 24.7; this is 24.75% higher than that of the median Industrials stock.
- Over the past 243 months, GGG's EV/EBIT ratio has gone up 6.4.
Below are key valuation metrics over time for GGG.
Stock | Date | P/S | P/B | P/E | EV/EBIT |
---|---|---|---|---|---|
GGG | 2023-11-09 | 5.9 | 5.9 | 24.7 | 19.4 |
GGG | 2023-11-08 | 5.9 | 5.9 | 24.7 | 19.4 |
GGG | 2023-11-07 | 5.9 | 5.9 | 24.8 | 19.5 |
GGG | 2023-11-06 | 6.0 | 6.0 | 25.0 | 19.7 |
GGG | 2023-11-03 | 6.0 | 5.9 | 24.9 | 19.5 |
GGG | 2023-11-02 | 5.9 | 5.9 | 24.5 | 19.2 |
GGG Growth Metrics
- The year over year net cashflow from operations growth rate now stands at -12.44%.
- The 4 year revenue growth rate now stands at 18.3%.
- Its year over year price growth rate is now at -15.04%.

The table below shows GGG's growth in key financial areas (numbers in millions of US dollars).
Date | Revenue | Operating Cash Flow | Net Income to Common Stock |
---|---|---|---|
2022-12-31 | 2,143.521 | 377.394 | 460.645 |
2022-09-30 | 2,128.095 | 371.217 | 454.685 |
2022-06-30 | 2,069.147 | 371.834 | 442.282 |
2022-03-31 | 2,027.764 | 386.552 | 435.022 |
2021-12-31 | 1,987.608 | 456.896 | 439.866 |
2021-09-30 | 1,918.329 | 488.547 | 434.325 |
GGG's Quality Factors
The “Quality” component of the POWR Ratings focuses on 31 different factors of a companies fundamentals and operational strength. Here are some key insights as we drill into the specifics of these quality attributes.- GGG has a Quality Grade of A, ranking ahead of 95.41% of graded US stocks.
- GGG's asset turnover comes in at 0.884 -- ranking 29th of 104 Machinery stocks.
- ALG, TNC, and CMI are the stocks whose asset turnover ratios are most correlated with GGG.
The table below shows GGG's key quality metrics over time.
Period | Asset Turnover | Gross Margin | ROIC |
---|---|---|---|
2021-09-24 | 0.884 | 0.523 | 0.502 |
2021-06-25 | 0.902 | 0.526 | 0.500 |
2021-03-26 | 0.862 | 0.522 | 0.405 |
2020-12-25 | 0.836 | 0.518 | 0.350 |
2020-09-25 | 0.838 | 0.515 | 0.329 |
2020-06-26 | 0.858 | 0.514 | 0.318 |
GGG Price Target
For more insight on analysts targets of GGG, see our GGG price target page. And for a list of of all stocks sorted by upside potential based on analyst target price, see our Top Price Target page.
Average Price Target | $83.71 | Average Broker Recommendation | 1.79 (Moderate Buy) |
Graco Inc. (GGG) Company Bio
Graco is an American manufacturer of fluid-handling systems and products based in Minneapolis, Minnesota. (Source:Wikipedia)
Latest GGG News From Around the Web
Below are the latest news stories about GRACO INC that investors may wish to consider to help them evaluate GGG as an investment opportunity.
Insider Sell: EVP, Chief Technology Officer Kathryn Schoenrock Sells Shares of Graco Inc (GGG)Graco Inc (NYSE:GGG), a renowned player in the manufacturing of fluid handling systems and components, has recently witnessed an insider sell that has caught the attention of investors and market analysts. |
Graco Inc. (GGG) is an Incredible Growth Stock: 3 Reasons WhyGraco Inc. (GGG) possesses solid growth attributes, which could help it handily outperform the market. |
Johnson Controls (JCI) Wins DOE Grant for Heat Pump ProductionJohnson Controls (JCI) is awarded a $33 million grant from DOE to bolster domestic electric heat pump production by expanding three U.S.-based manufacturing facilities. |
Donaldson (DCI) Declares Buyback Authorization & Cash DividendDonaldson's (DCI) board of directors announces a new share buyback plan to repurchase 12 million shares of its common stock and a regular cash dividend of 25 cents per share. |
Buy 5 Manufacturing Stocks Despite Disappointing October PMIWe have narrowed our search to five manufacturing stocks with strong potential for the rest of 2023. AOS, ATR, AIT, EMR, GGG. |
GGG Price Returns
1-mo | 6.37% |
3-mo | 7.21% |
6-mo | 0.09% |
1-year | 18.16% |
3-year | 26.79% |
5-year | N/A |
YTD | 23.39% |
2022 | -15.48% |
2021 | 12.57% |
2020 | 40.97% |
2019 | 25.94% |
2018 | -6.34% |
GGG Dividends
Ex-Dividend Date | Type | Payout Amount | Change | ||||||
---|---|---|---|---|---|---|---|---|---|
Loading, please wait... |
Continue Researching GGG
Here are a few links from around the web to help you further your research on Graco Inc's stock as an investment opportunity:Graco Inc (GGG) Stock Price | Nasdaq
Graco Inc (GGG) Stock Quote, History and News - Yahoo Finance
Graco Inc (GGG) Stock Price and Basic Information | MarketWatch
Loading social stream, please wait...