G-III Apparel Group, LTD. (GIII): Price and Financial Metrics

G-III Apparel Group, LTD. (GIII): $16.84

0.82 (+5.12%)

POWR Rating

Component Grades

Momentum

C

Stability

D

Sentiment

Quality

C

Add GIII to Watchlist
Sign Up

Industry: Athletics & Recreation

Industry

D

Ranked

#31 of 37

in industry

GIII Price/Volume Stats
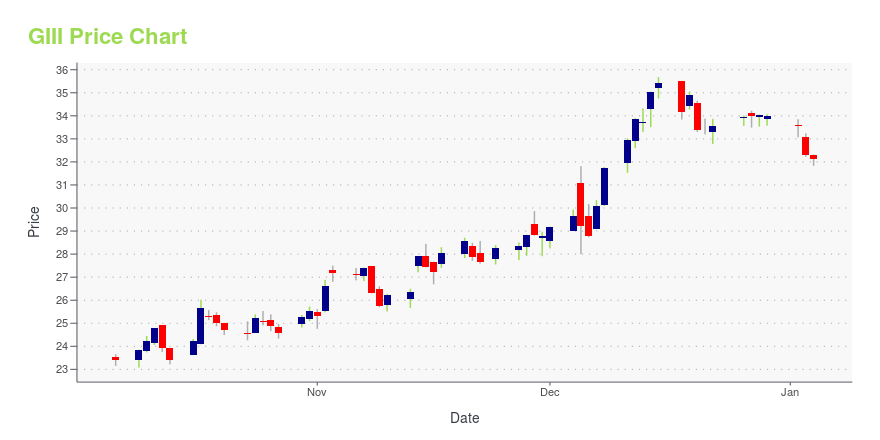
Current price $16.84 52-week high $28.12
Prev. close $16.02 52-week low $11.60
Day low $16.44 Volume 443,500
Day high $16.96 Avg. volume 584,410
50-day MA $15.90 Dividend yield N/A
200-day MA $16.66 Market Cap 767.75M

GIII Stock Price Chart Interactive Chart >

GIII POWR Grades

  • Value is the dimension where GIII ranks best; there it ranks ahead of 78.5% of US stocks.
  • GIII's strongest trending metric is Stability; it's been moving up over the last 179 days.
  • GIII ranks lowest in Stability; there it ranks in the 8th percentile.

GIII Stock Summary

  • G III APPAREL GROUP LTD's stock had its IPO on March 26, 1990, making it an older stock than 86.5% of US equities in our set.
  • GIII's price/sales ratio is 0.24; that's higher than the P/S ratio of just 8.2% of US stocks.
  • Over the past twelve months, GIII has reported earnings growth of -124.99%, putting it ahead of merely 12.46% of US stocks in our set.
  • If you're looking for stocks that are quantitatively similar to G III APPAREL GROUP LTD, a group of peers worth examining would be PRG, ELYS, IONM, ALYA, and TDS.
  • Visit GIII's SEC page to see the company's official filings. To visit the company's web site, go to www.giii.com.

GIII Valuation Summary

  • In comparison to the median Consumer Cyclical stock, GIII's price/sales ratio is 75% lower, now standing at 0.2.
  • Over the past 243 months, GIII's price/sales ratio has gone down 0.

Below are key valuation metrics over time for GIII.

Stock Date P/S P/B P/E EV/EBIT
GIII 2023-05-19 0.2 0.6 -5.7 -18.1
GIII 2023-05-18 0.2 0.6 -6.0 -18.6
GIII 2023-05-17 0.2 0.6 -5.9 -18.3
GIII 2023-05-16 0.2 0.5 -5.7 -18.0
GIII 2023-05-15 0.2 0.6 -5.8 -18.2
GIII 2023-05-12 0.2 0.5 -5.7 -17.9

GIII Growth Metrics

    Its 2 year cash and equivalents growth rate is now at -28.85%.
  • Its 4 year net cashflow from operations growth rate is now at 128.27%.
  • Its 4 year cash and equivalents growth rate is now at 817.84%.
Over the past 49 months, GIII's revenue has gone up $96,135,000.

The table below shows GIII's growth in key financial areas (numbers in millions of US dollars).

Date Revenue Operating Cash Flow Net Income to Common Stock
2022-09-30 3,120.455 -214.144 176.486
2022-06-30 3,057.548 -117.922 222.057
2022-03-31 2,935.385 149.925 204.906
2021-12-31 2,766.538 185.798 200.593
2021-09-30 2,544.625 186.941 166.805
2021-06-30 2,355.794 208.779 123.305

GIII's Quality Factors

The “Quality” component of the POWR Ratings focuses on 31 different factors of a companies fundamentals and operational strength. Here are some key insights as we drill into the specifics of these quality attributes.
  • GIII has a Quality Grade of C, ranking ahead of 70.24% of graded US stocks.
  • GIII's asset turnover comes in at 0.956 -- ranking 19th of 32 Apparel stocks.
  • LEVI, SKX, and COLM are the stocks whose asset turnover ratios are most correlated with GIII.

The table below shows GIII's key quality metrics over time.

Period Asset Turnover Gross Margin ROIC
2021-07-31 0.956 0.371 0.139
2021-04-30 0.907 0.376 0.110
2021-01-31 0.824 0.362 0.048
2020-10-31 0.904 0.354 0.048
2020-07-31 0.979 0.352 0.062
2020-04-30 1.066 0.343 0.073

GIII Price Target

For more insight on analysts targets of GIII, see our GIII price target page. And for a list of of all stocks sorted by upside potential based on analyst target price, see our Top Price Target page.

Average Price Target $38.43 Average Broker Recommendation 1.86 (Hold)

G-III Apparel Group, LTD. (GIII) Company Bio


G-III Apparel Group is a leading manufacturer and distributor of outerwear, dresses, sportswear, swimwear, women's suits, women's performance wear, footwear, luggage, women's handbags, small leather goods and cold weather accessories under licensed brands, owned brands and private label brands. The company was founded in 1879 and is based in New York, New York.


GIII Latest News Stream


Event/Time News Detail
Loading, please wait...

GIII Latest Social Stream


Loading social stream, please wait...

View Full GIII Social Stream

Latest GIII News From Around the Web

Below are the latest news stories about G III APPAREL GROUP LTD that investors may wish to consider to help them evaluate GIII as an investment opportunity.

A Triple Shot of Triple-Nets Deep in the Heart of Value Land

Perusing the ranks of companies trading at relatively low multiples of net current asset value (NCAV) this weekend, in this case "triple-nets," or companies trading at between 2x and 3x NCAV revealed a handful of interesting candidates. Cricut, Inc. , which designs and markets equipment used for handmade items, including cards, and t-shirts, currently trades at 2.97x NCAV. The shares have fallen 28% since first-quarter earnings were released on May 9, and revealed worse-than-expected earnings per share ($0.04 versus $0.07 consensus) and revenue ($181.2 million versus $204 million).

Yahoo | May 22, 2023

Is G-III Apparel Group, Ltd. (GIII) a Cheap Stock?

Investment management company First Pacific Advisors recently released its “FPA Queens Road Small Cap Value Fund” first quarter 2023 investor letter. A copy of the same can be downloaded here. In the first quarter, the fund returned 0.70% compared to a -0.66% return for the Russell 2000 Value Index. The firm expects the fund to outperform in down […]

Yahoo | May 5, 2023

G-III Apparel Group (NASDAQ:GIII) Has More To Do To Multiply In Value Going Forward

There are a few key trends to look for if we want to identify the next multi-bagger. In a perfect world, we'd like to...

Yahoo | May 2, 2023

Why Is PVH (PVH) Down 5.7% Since Last Earnings Report?

PVH (PVH) reported earnings 30 days ago. What's next for the stock? We take a look at earnings estimates for some clues.

Yahoo | April 26, 2023

Top 10 Luxury Clothing Stocks to Buy

In this article, we will take a look at the top 10 luxury clothing stocks to buy. To see more such companies, go directly to Top 5 Luxury Clothing Stocks to Buy. The luxury goods market is famous for staying resilient and strong during recessionary environments. That’s because the rich and wealthy are usually the […]

Yahoo | April 16, 2023

Read More 'GIII' Stories Here

GIII Price Returns

1-mo 14.17%
3-mo -1.64%
6-mo 37.36%
1-year -37.14%
3-year 25.39%
5-year -60.73%
YTD 22.83%
2022 -50.40%
2021 16.43%
2020 -29.13%
2019 20.11%
2018 -24.40%

Continue Researching GIII

Want to see what other sources are saying about G Iii Apparel Group Ltd's financials and stock price? Try the links below:

G Iii Apparel Group Ltd (GIII) Stock Price | Nasdaq
G Iii Apparel Group Ltd (GIII) Stock Quote, History and News - Yahoo Finance
G Iii Apparel Group Ltd (GIII) Stock Price and Basic Information | MarketWatch

Get Free Updates

Join thousands of investors who get the latest news, insights and top rated picks from StockNews.com!